Building an SSH Honeypot and analysing the results with Elastic Stack
Introduction
TL;DR - If you just want to see the biggest offender countries and the most popular user names and passwords, jump directly to the Results section.
This article covers the topics:
- Analysis of login attempts to an ssh server open to the internet
- Using Golang concurrency
- Terminal UI’s
- ElasticStack (Also known as ELK)
- Basic ssh server best practises
This post is half about what you will find if you run an ssh honeypot or ssh server exposed to the internet and half not. I used the ssh honeypot component as an excuse for building and playing around with some basic ‘security analytics’ using the Elastic stack.
Over the years I have run many ssh servers that are exposed to the internet, for both personal and work use and every time, as everyone does, I get unsolicited visitors knocking on the door. In the past I have run the logs through various tools and scripts to see who is trying and where they come from. However I have never drilled into the data or deliberately run a honeypot purely for research purposes.
I fancied having a go at writing a simple honeypot to see who comes knocking. I wanted to write something simple, but with a few additional elements for fun and learning.
I also wanted an excuse to try out the Elasticstack. I have used Splunk a lot and I know how easy it is using Splunk to analyse log data and build pretty dashboards. I also know how easy / hard Splunk is to setup and administer so I wanted to compare it with Elastic. Elastic has the one major advantage over Splunk in that it doesn’t cost of fortune to fill with data.
I ran my honeypot for about a month on a server exposed to the internet and collected the log data which was in turn fed to Elasticsearch. You can see the results below.
Before we get into the guts of it though, if you need to or want to run servers with an ssh interface exposed to the internet, please be careful and take precautions! A lot of my millions of readers(!) will already know all this, but in case you need a refresher, please refer to the Appendix below for some tips on being more secure when running real ssh servers exposed to the internet.
The Honeypot
Firstly lets clear up a couple of initial questions
What is a honeypot?
Simply put it is a system that seems legitimate and therefore attractive to malicious actors but is actually just a fake, severely restricted or simulated system used to bait, trap and analyse attackers.
Sophisticated honeypots allow attackers to login to an isolated but heavily monitored system which serves multiple purposes: It allows security researchers to analyse what attackers are potentially attempting to do, it acts as an alarm or early warning system for potential attacks and it can be used to tie up an attacker and get them stuck in a fake system they can’t really escape from. Hence the name honeypot, to a wasp it looks like a tasty target but is actually a trap.
My honeypot is not that sophisticated. Maybe further down the track I will do a more sophisticated honeypot to take a deeper look at the types of uses attackers put a machine to once they breach it. But for now, I just wanted to watch and see where attempted logins come from, how often they come, and what credentials attackers try to use.
Why write my own Honeypot?
As with everything I have done here recently one could ask again ‘Why write your own ssh honeypot? There are plenty of ready made like honeypot configs and software Kippo or Cowrie available already!’
The answer is the same as always, I wanted to learn how to do it for myself and use it as the basis to learn other things. I also had a couple of other motives to justify the effort.
Firstly a lot of the other honeypot implementations I looked at went to great lengths to store the data for analysis, spinning up database instances and all manner of other supporting infrastructure. I didn’t want to do that. I didn’t want the hassle or overhead of using a full blown relational database, I didn’t want to use any sort of database reporting services and I didn’t want to have to write analysis tools. I wanted a way of analysing and visualising the data in real-time. To me the slickest and simplest way of doing this was to log to a file and pump it into Elasticsearch. I knew what Elasticsearch did and how it worked, but I had never had a reason to try it in anger. So I invented one! I could also be clever and write my logs in a structured format like JSON to make indexing easier.
Secondly, I wanted to mess around with a basic terminal UI. I have always enjoyed terminal utilities that have some sort of visual UI, practical or not. For this tool there is no practical need for one, in fact it would have been better to just daemonize the process and let it happily log away in the background. But where is the fun in that! So my honeypot tool had to have at least a minimal terminal UI which will show attempts as they happen as well as logging to a file for ingestion into Elasticsearch.
My Implementation
As with everything I do lately, my ssh honeypot is implemented in Go. As it turns out Go is perfect for this sort of thing. The entire implementation is less than 300 lines of code. All of which can be found on my GitHub site here: https://github.com/andrewsjg/ssh-honeypot
I had four requirements:
Allow an attacker to enter a username and password via an ssh connection but reject every attempt.
Geolocate the attacker via a GeoIP lookup
Write the results to a JSON log file
Output the results to the terminal in a “pretty” way
The ssh server
I actually intended to use the built-in Golang ssh support to handle all the ssh components but I opted to use gliderlabs/ssh instead. To quote the GitHub page:
"[gliderlabs/ssh] wraps the crypto/ssh package with a higher-level API for building SSH servers."
Perfect!
Using the gliderlabs/ssh package you can instantiate an ssh server and implement a set of callbacks to handle password auth, public key auth, sessions, request etc. In other words, build a complete bespoke ssh server if you want to. For my use case however, all I needed was the password handler. To that end, my honeypot ssh server requires only the following:
s := &ssh.Server{
		Addr:  ":" + sPort,
		PasswordHandler: passwordHandler,
	}
passwordhandler is the function that handles the password auth and the bulk of the honeypot logic.
Apart from having to setup the host key (which I’ll be honest, I couldn’t make work the way shown in the gliderlabs documentation, so had to resort to using the base crypto/ssh methods) that’s about all there is to getting the ssh honeypot server started. All the rest of the work happens in the password handler.
The password handler is a function that gets called by the ssh server when a login requests password auth. It is passed the ssh context and a password and returns a bool. Returning true if password validation passes and false if not. If the function returns false, control is passed back to the core server and it will prompt again for the user to enter his or her password. It will repeat this until the retry limit (3 by default) is hit at which point the ssh session is terminated. Therefore, for the honeypot functionality I required all I need to do was have the password handler return false all the time, regardless of input.
When the password handler fires, it also handles the two of the three remaining items from the list above:
- Geolocation on the source IP address
It does this using the MaxMind GeoLite2 database and a Go package I found for reading them: https://github.com/oschwald/geoip2-golang. There is some logic for filling place holder data if the geolocation returns no values, but other than that its pretty basic.
- Write the data out in JSON format to a log file
I format the geolocation data and the session data (username and password) into a simple JSON dictionary and use the Go log package to write it out to a log file. The only non-default thing I do is turn off the log package timestamping because I want to embed the timestamp in the JSON object rather than have it prefix the log line.
The final thing to do from my list of four requirements above is to output the result to the terminal. The password handler doesn’t do this, but what it does do is send the JSON output to the textUpdates channel.
A channel is a Go construct used from inter-thread (sort of) communication. The textUpdates channel. is a global channel object that is used for UI the updates. Channels and Go concurrency are discussed below.
Go Concurrency
One thing Go makes super easy is running things concurrently using Goroutines. By simply adding the go keyword in front of a function call, Go will run the function concurrently with the rest of the execution. For my honeypot, I want to the ssh server to run concurrently with the UI so I can handle incoming requests and update the UI without blocking either execution thread. To do this I start the ssh server as a goroutine:
s := &ssh.Server{
		Addr:            ":" + sPort,
		PasswordHandler: passwordHandler,
}

.
.
.

go s.ListenAndServe()
As with all concurrently executing programs, this adds a requirement for communication and synchronisation between concurrently running code. The mechanism for doing this in Go is channels.
Channels are a safe mechanism to connect and send data between Goroutines. To create a channel, you declare a variable of type chan and give it a transport datatype. Meaning declare what datatype the channel will contain. You then need to initialise the channel using the make function.
In the case of my ssh-honeypot I use one channel for sending and reading updates for the terminal UI. This is declared as a global variable (accessible by all goroutines) of type chan with a transport type of string:
var textUpdates chan stringIn the main function the channel is created:
textUpdates = make(chan string)We now have a channel that we can use to pass string data between goroutines. As discussed above, the password handler does this, sending the JSON string:
jsonOutput = "{\"date\": \"" + time.Now().Format(time.RFC3339) + "\",\"user\": \"" + ctx.User() + "\", \"password\": \"" + password + "\", \"ip_address\": \"" + ipAddr + "\",\"city\": \"" + city + "\", \"region\": \"" + region + "\", \"country\": \"" + country + "\",\"latitude\":" + lat + ",\"longitude\":" + long + "}"

// Send the output to the textUpdates channel for rendering on the TUI
textUpdates <- jsonOutput
Note the syntax, the textUpdates channel receives the jsonOutput string using the left hand arrow syntax <-. This is writing to the channel. Later we will see how a variable gets assigned a value from a channel, or reading from the channel.
The Terminal UI
For the terminal UI all I wanted to do was have a pretty way of outputting the login attempt data to a terminal window. I chose to use the termui package. Coming back to to doing terminal UI’s after a long period of not bothering and having never done it with Go, I was concerned it might be a complicated pain in the backside. Turns out, its actually quite easy. Never the less I wanted to start with a very simple UI.
The whole implementation of the terminal UI for my ssh honeypot is basically just stolen from the termui examples. I use the termui Paragraph widget to draw a box the size of the current terminal window on screen, then I simply append lines to the Paragraphs text property as new data comes in.
The UI gets rendered in the terminal window, the package creates a ui.PollEvents channel into which all interaction events are posted. For example, key-presses and window resizing events.
Inside the main loop of the program the pollevents channel is watched and actions are taken as events are posted. This is another place where channels are very nice. Using the select operation allows a groutine to wait on data from multiple channels. Select looks like a switch operation however each case has to be a channel operation. Using this we can react to UI events, such as resizing the window, exiting the program when ‘q’ is pressed or writing some text to the screen when a message is received via the textUpdates channel.
The code block below shows the main program loop with the UI updates from the textUpdates channel and reacting to UI events from the ui.PollEvents channel:
uiEvents := ui.PollEvents()
	for {
		select {
		case e := <-uiEvents:
			switch e.ID {

			// Quit when q is enterd
			case "q", "<C-c>":
				return

			// Adjust the UI boarder when the window is resized
			case "<Resize>":
				payload := e.Payload.(ui.Resize)
				logTextBox.SetRect(0, 0, payload.Width, payload.Height)
				ui.Clear()
				ui.Render(logTextBox)
			}

		case msg := <-textUpdates:
			var loginData LoginData
			err := json.Unmarshal([]byte(msg), &loginData)

			if err != nil {
				logTextBox.Text = logTextBox.Text + "\n" + msg + " error: " + err.Error()
			} else {

				loginMsg := formatOutput(loginData)
				newText := logTextBox.Text + "\n" + loginMsg

				// If the output is about to fill the textbox, trim by one line.
				if countRune(newText, '\n') > logTextBox.Bounds().Dy()-3 {
					newText = trimToChar(newText, "\n")
				}
				logTextBox.Text = newText

			}

			ui.Render(logTextBox)
		}
	}
As JSON messages come in on the textUpdates channel. Note the opposite syntax for reading from the channel, the channel is assigning values to a variable this time round. The JSON strings are unmarshalled into a custom type and the values are composed into a nice colourful string that is rendered in the termUI Paragraph.
Go and the termui package makes this sort of thing very easy. A lot easier than I expected. I will definitely be playing around with terminal UI’s more.
Below is an example of the terminal output of the Honeypot:
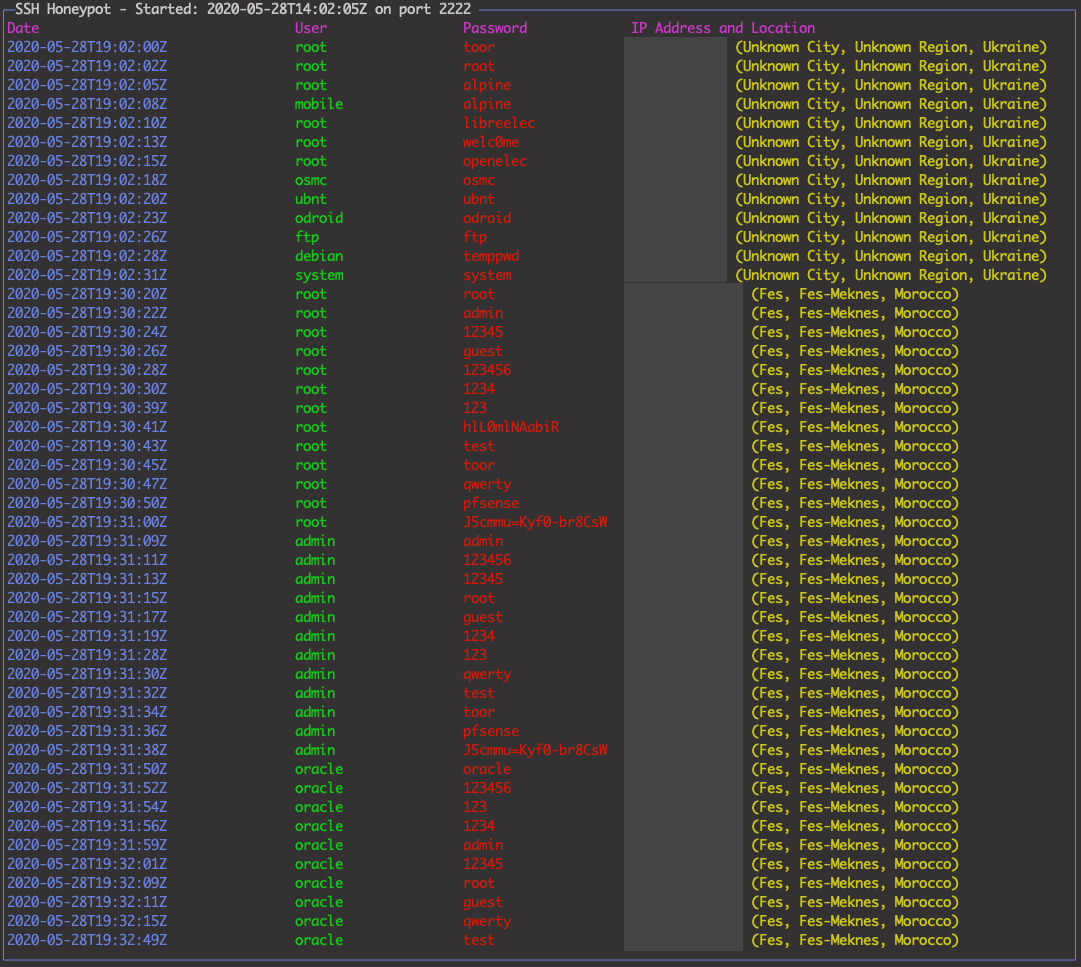
Note: The IP addresses have been deliberately redacted!
This uses a tabular format that I create myself in the output. There are other widgets and other UI toolkits that render tables If I update this tool, I may use one of those instead of the format shown above.
Elastic Stack
The Elastic Stack also referred to as ELK because the core consists of ElasticSearch, Logstash and Kibana (they seem to prefer Elastic Stack now, because the stack is more than just ELK), is a stack of tools for extracting, transforming, loading indexing, searching and visualising data. Typically, but not exclusively, from log file sources. The Elastic Stack components together are an open source alternative to Splunk.

I decided I wanted to know more about how ElasticSearch worked and this seemed like a good excuse to use it with some real data I needed to analyse.
Installation
For my OS platform to host all these tools I used a minimal install of Ubuntu 20.04 LTS server.
To install the ElasticStack, I followed this guide: https://logz.io/learn/complete-guide-elk-stack/#installing-elk Its easy to follow and gets everything you need installed.
It’s all pretty straight forward, everything is nicely packaged and can be installed using apt from available repositories.
There is some minimal changes you need to do within the yaml config files to make the system listen on the right interfaces if you want to query it from a machine other than localhost and to wire up Kibana to ElasticSearch. It was all pretty intuitive from an install point of view. Within about 15 minutes I had everything I needed installed and running.
I skipped installing LogStash because I decided I wouldn’t need it (see below). I already had the data in the format I needed and I didn’t need to aggregate from multiple sources so LogStash is overkill. I may revisit LogStash later for another use case.
Below I cover how I used each component.
ElasticSearch
ElasticSearch is the core of the stack, providing the engine for indexing and querying unstructured data.
ElasticSearch has a powerful REST API for pushing data in and querying indexed data. It via this REST API that everything integrates. This is one way that Elastic is different from Splunk. The primary interface with the search engine is via a REST API.
For example, I can query my instance using the curl command:
curl -XGET --header 'Content-Type: application/json' "http://elastic:9200/filebeat-*/_search?pretty" -d '{
     "query" : {
        "range": { "@timestamp": {"gte" : "now-7d/d"}}
        }
}'
Note: Because my instance only has my honeypot data in it I can query the entire dataset in the ElasticSearch filebeat index (more in this below). In reality you’d want to filter the data properly or make sure data goes into specific indexes within ElasticSearch.
After the query completes, I’ll get a back a bunch of JSON data that I can use in any way I desire. For example the results for the query above against by honeypot data will contain the block:
"json" : {
            "date" : "2020-05-22T04:55:55Z",
            "country" : "Indonesia",
            "password" : "@dminsya",
            "city" : "Batusari",
            "latitude" : -6.5196,
            "longitude" : 107.7355
            "ip_address" : "XXX.XXX.XXX.XXX",
            "region" : "West Java",
            "user" : "support"
          }
Pretty useful in and of itself if. You can of course write all sorts of scripts and tools to make use of this data as you see fit. However I was more interested in visualising the data. For that I used the graphical interface for ElasticSearch, Kibana.
But before we get to that, we need to cover off how the data gets into ElasticSearch. For that I used Filebeat.
Filebeat
Because of its API first REST based ingest model, there is a lot of flexibility for getting data into Elasticsearch. To build an end-to-end log management and indexing platform, you would consider using the “L” in the ELK stack acronym: Logstash
Logstash is one mechanism to feed logs back to ElasticSearch. Logstash is designed to pull logs from multiple sources, transform the data and push to a storage location. It is a full fat Extract, Transform and Load (ETL) tool.
However Logstash is fairly heavy duty so you don’t necessarily want to run it on every node you need to feed log data from. Rather you deploy it centrally and have logs pushed or pulled to it and use the central cluster for the ETL processes. The Load step in this case being the send to ElasticSearch. With Logstash in place, you can really scale up log management and the ingest pipeline for Elasticsearch.
So how do you efficiently get data to LogStash? That is where Beats come into play. Beats are light weight agents that read a data source (a log file for example) on an endpoint and send the raw data on to either Logstash for the ETL pipeline or alternatively directly to Elasticsearch.
The image below (courtesy of Elastic.co). Shows how a full log management and indexing platform is built out using Logstash to ingest logs from multiple sources, transform it and then pass it on to Elasticsearch for indexing.
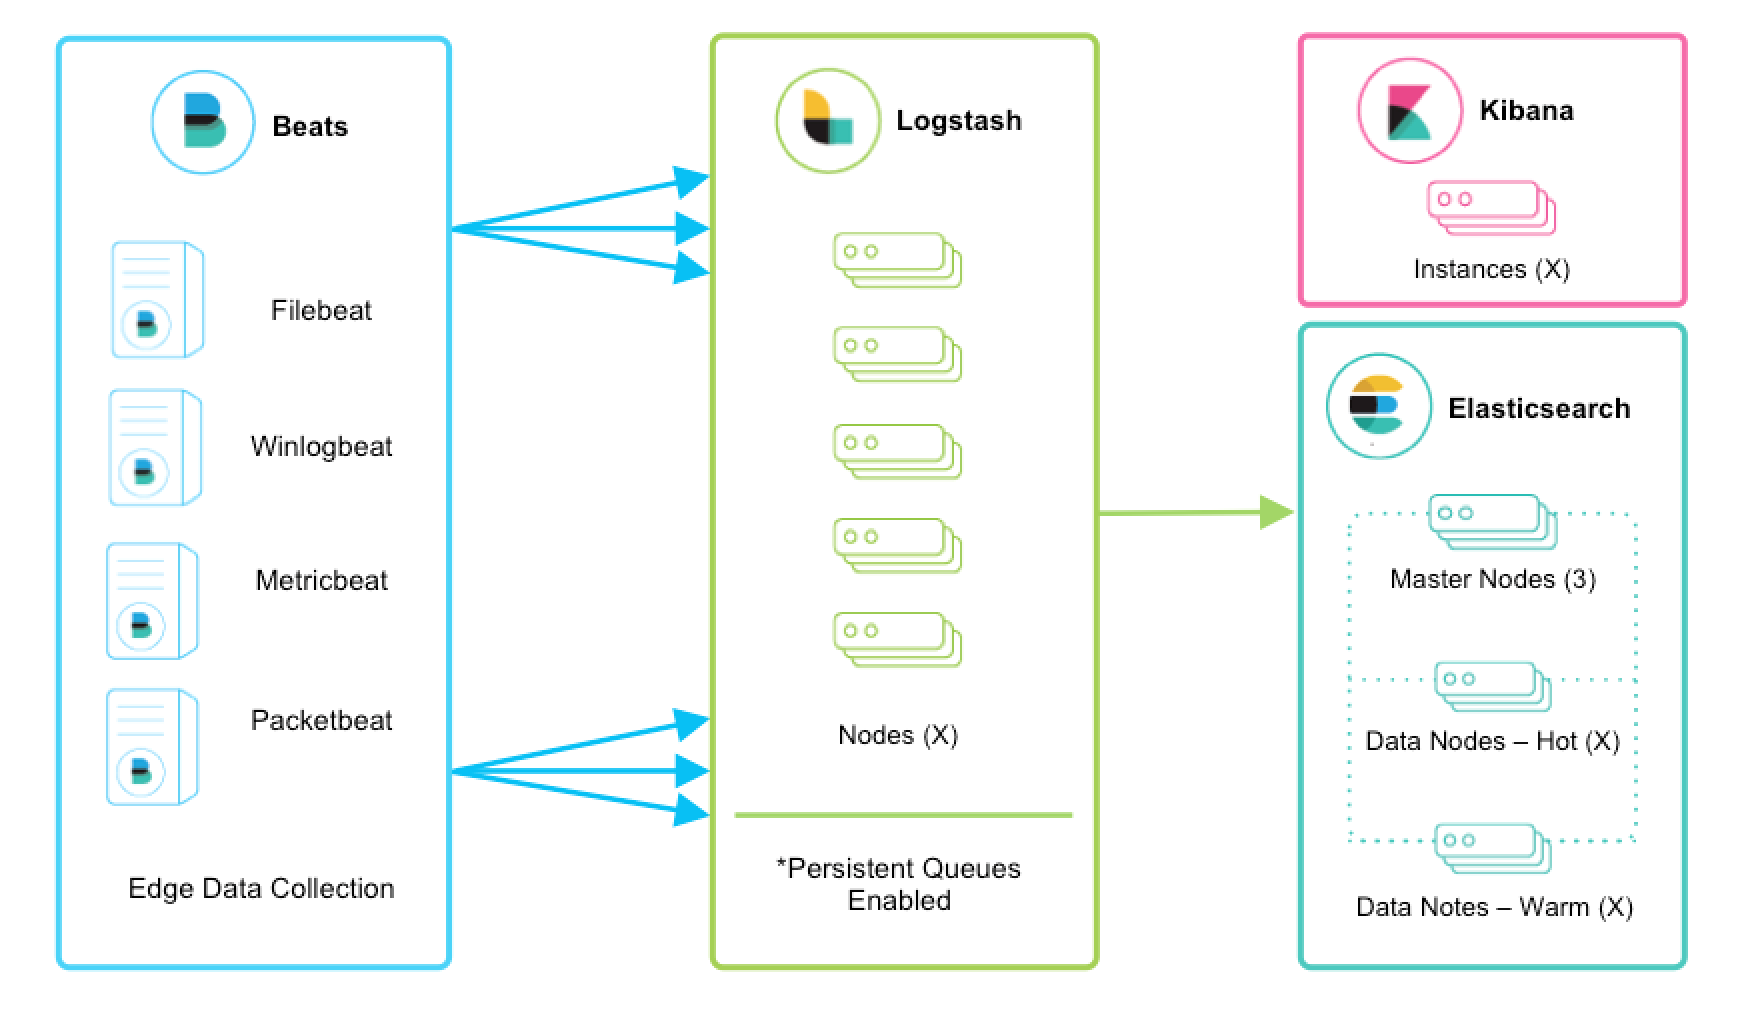
If you are doing a smaller scale project, such as my honeypot project, you don’t necessarily need the Logstash layer to scale or provide the ETL functions. In my case I have only one source: the SSH Honeypot log. In addition, because I have complete control over the output I could skip any transformation logic by ensuring the logs already contain structured JSON objects.
Note that I could push any log data into Elasticsearch, it doesn’t have to be JSON or any other format. However it does help if it is a well known format because Elastic will automatically know how to parse it out into fields on ingest. If you use a non-standard log structure you can still push data into Elasticsearch, but you will either need to build a custom ingest pipeline to do the field extractions or build queries in Elastic to make sense of the raw logs.
I chose to push the data using the Filebeat agent directly into my Elasticsearch instance. Taking advantage of the JSON parsing features in Filebeat (more on that below)
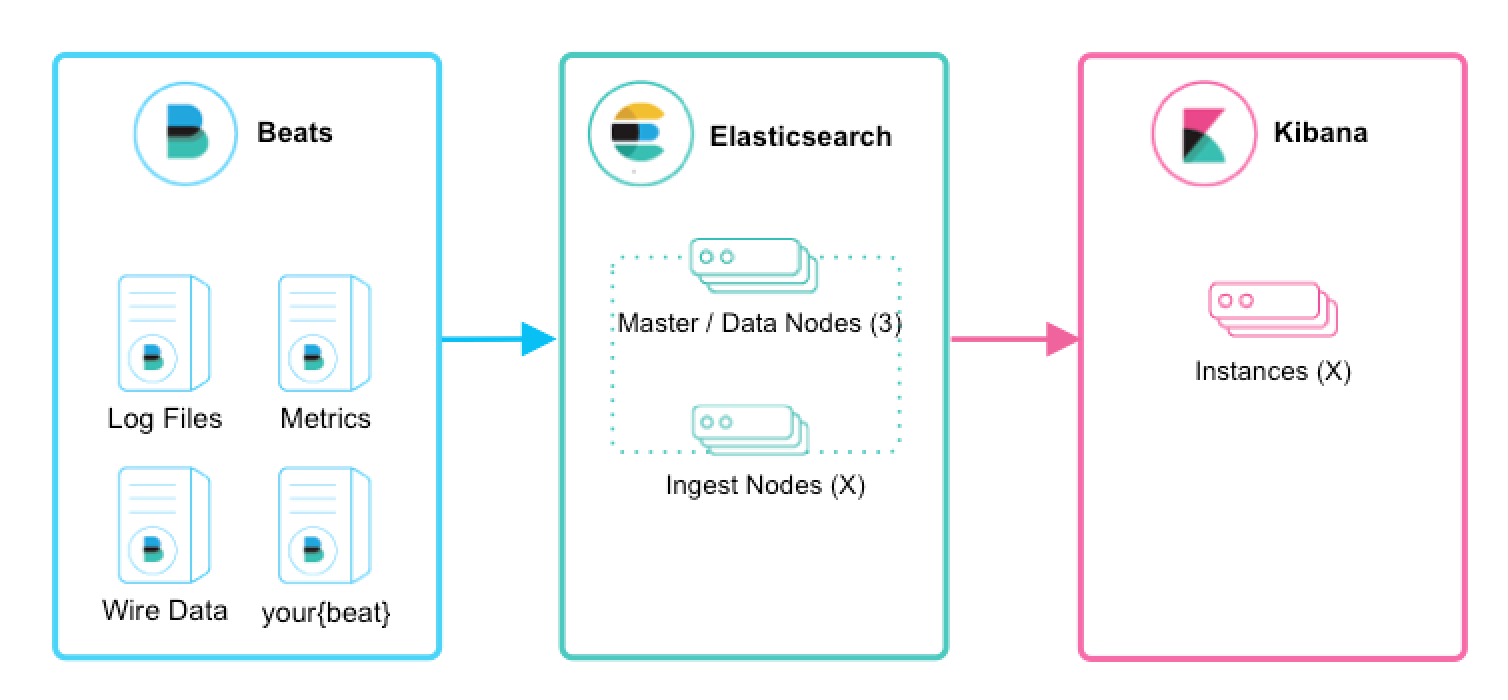
In this instance I have removed the ‘L’ from ELK. This is why Elastic are using the ‘Elastic Stack’ name more now, because it is not just E,L and K.
I installed the Filebeat agent on my server and configured it to watch my honeypot log and to send data directly to my Elastic search instance. The configuration was very simple.
Filebeat has built-in support for many input types as well as just raw log files. You can use it to easily ingest data from a lot of common sources. For example it can connect to an Apache Kafka stream, listen to an AWS SQS queue and read S3 data, it understands Syslog, you can point it at an HTTP JSON source. And if none of that works you can use the log file input, standard input or raw TCP/UDP sockets. It is extremely flexible.
For my setup I simply configured a log input (more on this below!).
filebeat.inputs:

# Each - is an input. Most options can be set at the input level, so
# you can use different inputs for various configurations.
# Below are the input specific configurations.

- type: log
  enabled: true
  paths:
    - /opt/ssh-honeypot/*.log
  json.message_key: ip_address
To send to Elastic Search, configure the Elastic Search output. As with inputs, Filebeat supports multiple outputs. For example, Logstash (as per the architecture above).
#-------------------------- Elasticsearch output ------------------------------
output.elasticsearch:
  # Array of hosts to connect to.
  hosts: ["myelasticserver:9200"]
  pipeline: geoip-info
Note the pipeline: geoip-info item. This was added to the config to direct the filebeat logs through a custom pipeline on Elastic Search which enriches the data based on the source IP address. Even though I do the GeoIP lookup in my code, I discovered that Elastic can also do it for me and generate the geo fields in Elastic Search that make rendering the data on a map (see below) easier. There is a guide for setting this up on the Elasic.co site.
Everything else in the config was left as default.
In configuring Filebeat I did strike some issues. Firstly the documentation around filebeat. It seems some of the config structure and terminology has changed between versions and the documentation hasn’t quite kept up. If you follow some guides or even accidentally read the wrong documentation on the Elastic site, it might use an older config format which filebeat kind of accepts, but fails in unusual ways. The logs for the filebeat daemon are not overly helpful at times so debugging issues was not straightforward. I made some simple errors, but couldn’t see from the logs what was wrong. This was frustrating. Luckily there are a lot of community posts that can help.
Because I had JSON formatted logs, using filebeat to send the data for indexing should have been easy. However this is another area where I found a shortcoming of the Elastic stack. According to the documentation it should have been as simple as adding the following to the filebeat input config:
# Do not prefix the parsed fields in the index with the 'json'
# tag, just add them as root fields
json.keys_under_root: true

# Add an error key to expose marshalling errors to elasticsearch
json.add_error_key: true

# Specifiy a key field to help parse multi-line objects
json.message_key: <key field>
The documentation states:
These options make it possible for Filebeat to decode logs structured as JSON messages. Filebeat processes the logs line by line, so the JSON decoding only works if there is one JSON object per line.
This should have worked (even without the json.message_key setting) because my logs consist of single line JSON messages that look like:
{"date": "2020-05-28T04:05:02Z","user": "root","password":"1234", "ip_address":xxx.xxx.xxx.xxx","city": Moscow", "region": "Moscow", "country":Russia","latitude":55.752700,"longitude":37.617200}
However, if I tried the config shown above, filebeat would pretty much ignore the data. I could see in the filebeat logs that it was reading the logs, but it seemed to be saying that it found no objects to parse. I tested my log format in case I had a stray carriage return or it wasn’t writing the files in a single block, but everything was fine. I could read and parse everything line by line with my test code.
As I said above, the filebeat logs themselves provided very little information as to what the problem was. If I pointed Filebeat at other logs it worked fine and if I removed the json config from my input it also worked, but it didn’t parse out the fields in my object.
I didn’t really work out what the issue was, but I discovered by trial and error that it worked as long as I removed all the config options apart from the json.message_key option and told it to use the ip_address field as the key. This forced filebeat to look for lines with that key and kicked it into life.
It was annoying having all my fields prefixed with json in the index (because I could use the json.keys_under_root setting), but I could live with it. I don’t know why it did just read my one json object per line file and parse it like the documentation says it should. Additionally, I would expect it to be able to just deal with a log if I told it it was all json. I found this very frustrating. Splunk does a very good job of making sense of data that you just throw at it.
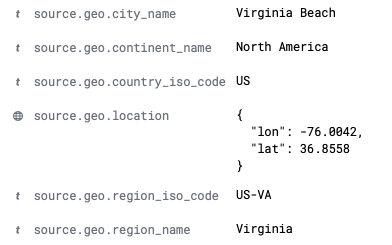
When it all worked, this is how my log entries get parsed out and how the data appears in each event within Elasticsearch:
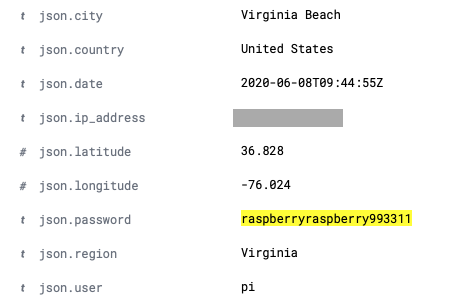 Note the
 json.<fieldname> prefix. This is a result of not being able to use the json.keys_under_root: true option. I assume the problem is that my field names clash with some system field names and so filebeat couldn’t marshal everything properly. But that wasn’t shown in the logs. I will change my field names and retest at some point. Also note the raspberryraspberry993311 password. This turned out to be interesting.
Due to using the geoip_info pipeline discussed above, the country, city and lat/long fields are a bit redundant. The pipeline enriches each event and adds the following fields on ingest:
This is pretty neat and I can see it being super useful for other logs (web server logs for example). Splunk has this functionality similar to this also but it does the geo lookups at search time. By default Splunk doesn’t enrich each event with the geolocation data. I have used the Splunk functionality a lot and it is really nice to find it essentially builtin here in Elastic as well.
I could tell Elastic to just use my data for the mapping data, but it was really neat to play around with tools for enriching the data on ingest. I do also like having the GeoIP data in the source logs as well though to enable other possible use cases, so I don’t think either effort is wasted.
Once I figured out how to get my data into Elastic Search via Filebeat everything was good. Data started appearing as it should in the filebeat-* indexes in Elastic Search. But it took me a lot longer to figure out the filebeat configuration and issues than I expected. It seems like some of the filebeat functionality is still pretty new and the product is still evolving a lot. In this respect Splunk is a lot better in terms of just getting data into the system and parsing simple data formats.
One thing I would change is adding a new index for the honeypot data alone. If I had other filebeat agents feeding in it would make searching less efficient. I might circle back and do that, but I wanted to move on and start looking at the data and building dashboards. For that I needed to use Kibana
Kibana
The final component of the Elastic Stack I used was Kibana. Kibana is the web UI and frontend for accessing Elastic Search.
Unlike Splunk, Elastic Search does not include a graphical UI as part of the search engine itself. You can deploy and use Elastic Search without any sort of graphical UI and there are many use cases where you might want to do exactly that. As such the Elastic Search component comes without the additional overhead of the UI for every indexer instance.
In a large production deployment you would build an Elastic Search cluster to handle the indexing and query load and point a set of independent load balanced Kibana nodes at the cluster for interactive user access.
Kibana enables users to easily query indexed data, visualise it using charts, tables and other widgets and save them on a dashboard.
The interface and data representation will look somewhat familiar to Splunk users.
A couple of things to note. Kibana doesn’t have the same field extraction capability as Splunk. Fields need to be extracted on ingest or defined as scripted fields up front. Kibana queries are therefore more rigid than Splunk can offer. In addition Kibana doesn’t support a query pipeline like Splunk does. Both of these differences makes Kibana queries a lot simpler than Splunk but at the expense of query power. Splunk queries can be large and complex and can slice and dice the data in any way a user can imagine. The Kibana query language doesn’t provide as much flexibility.
The Elastic Stack puts the responsibility for enriching data on the ingest processes. This is where the power of the ETL functions in LogStash and the ingest pipelines come in to ensure the data is available in Elastic Search in a way that makes it cleaner to query and view with Kibana.
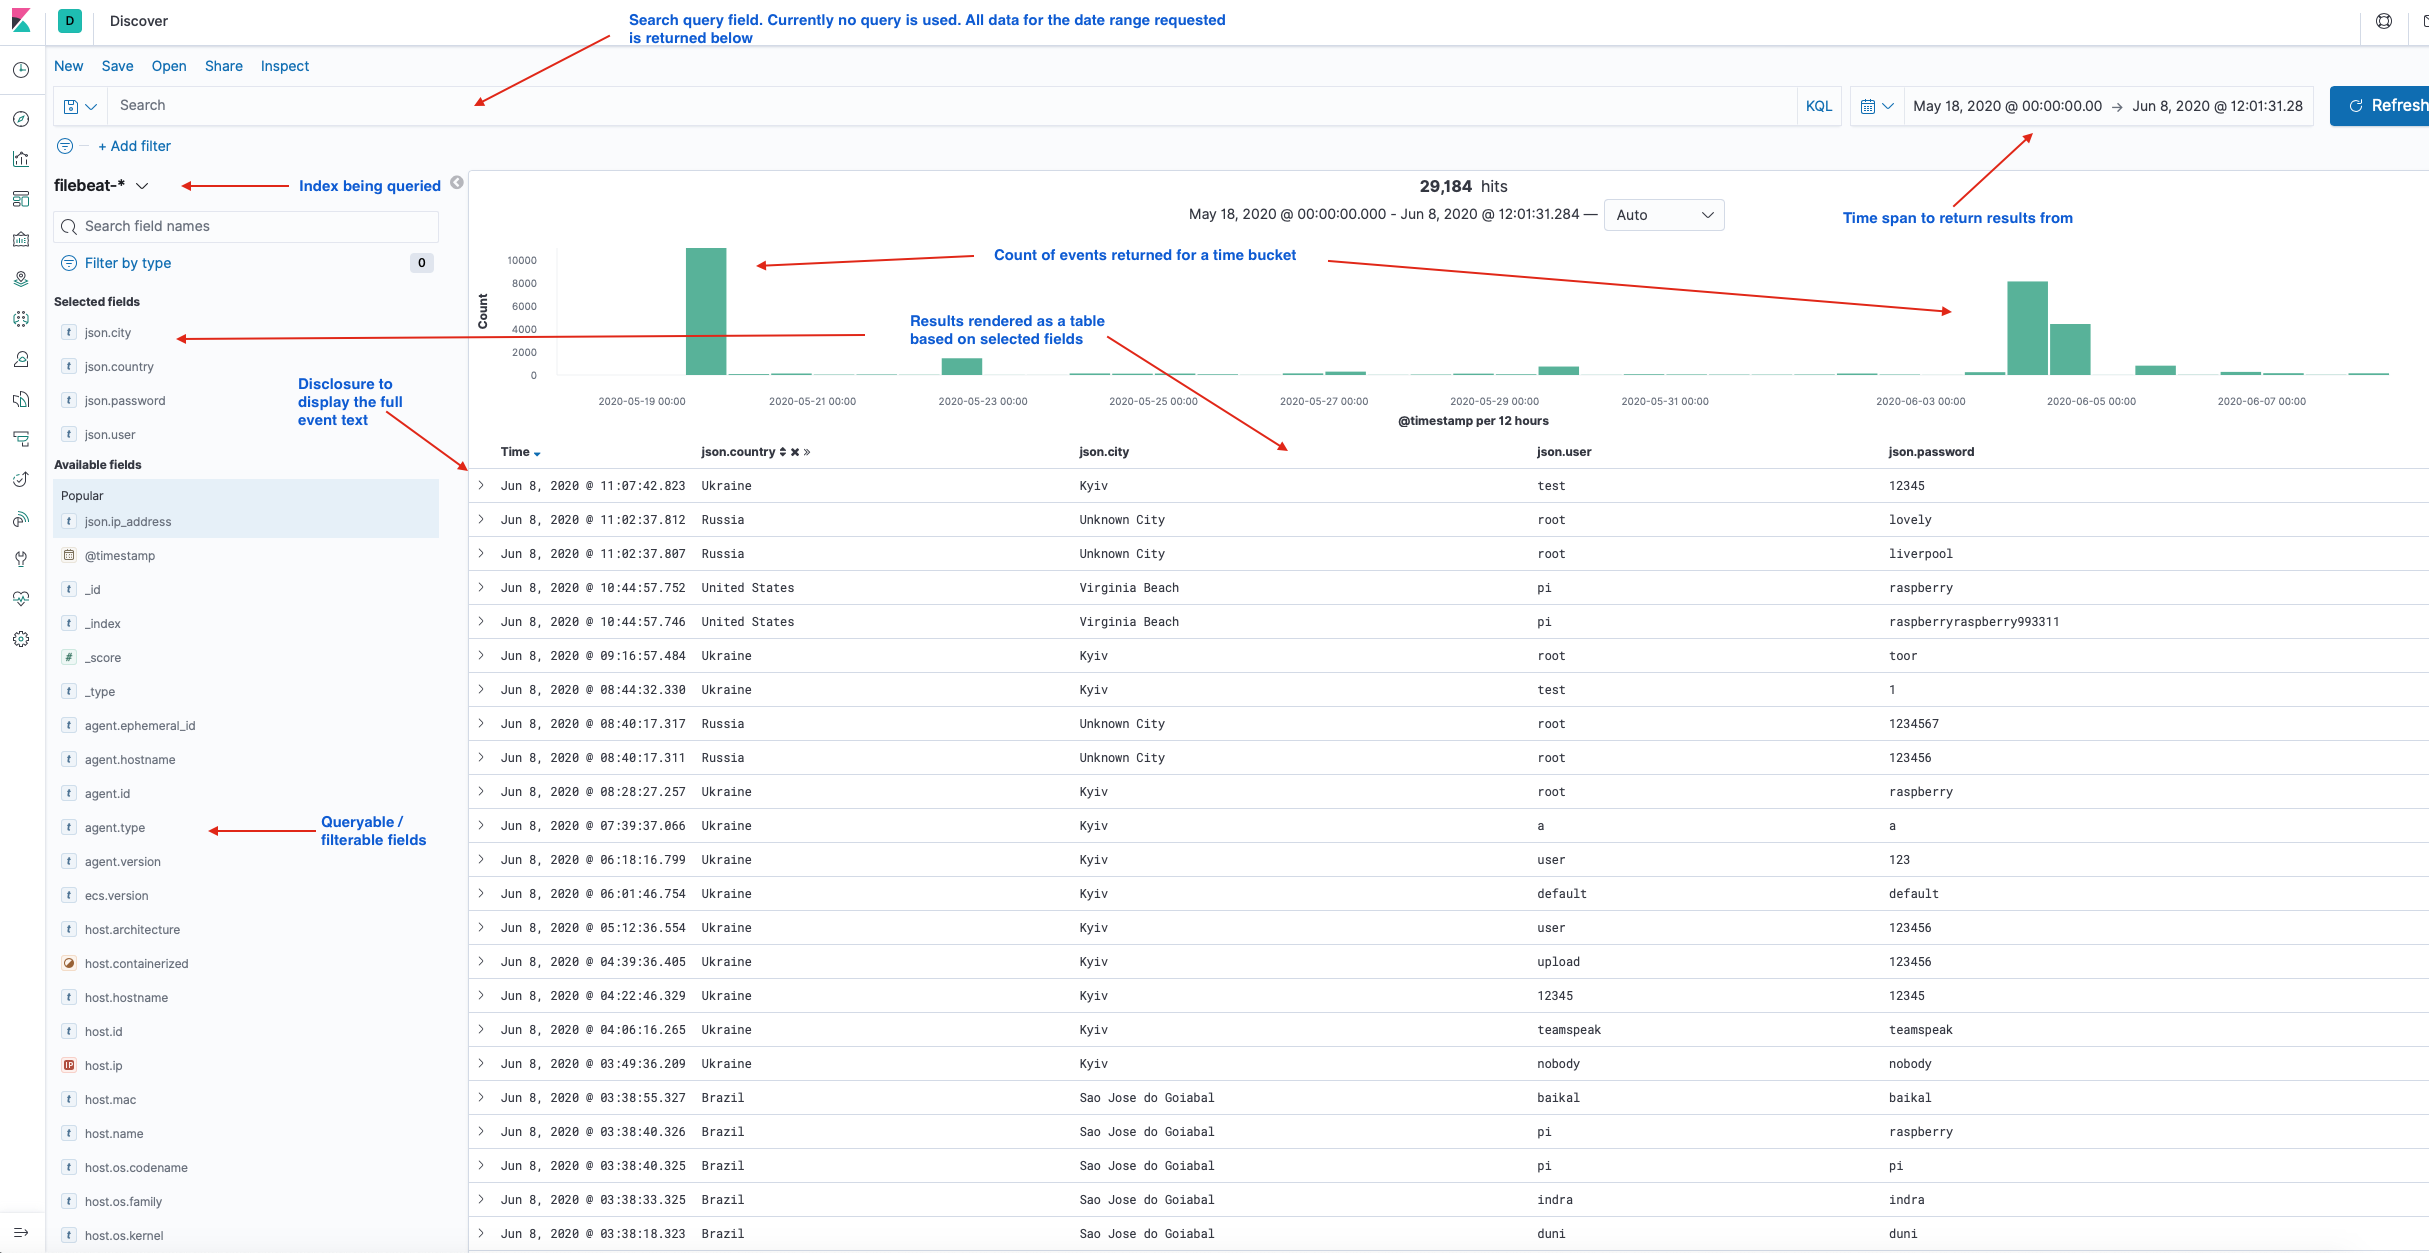
Kibana consists of a number of feature areas that provide different functions ranging from general queries against logs using the Discover function to a full featured Security Information and Event Management (SIEM) implementation. For this use case however I want to focus on just the Discover,Visualize,Dashboard and Maps features.
Note: This is just a simple overview and tour of each of these sections as they apply to my use case and is by no means a deep dive.
The Discover feature is the main query tool and used to search through logs to extract data of interest, build table views or just inspect field values. Queries can be saved for use later or use on Dashboards. See the screenshot above for an example.
Visualisations are also easy to produce in Kibana. Either via the Visualisation feature or by selecting fields within the Discover tool and selecting the Visualize option from the fields list in the left hand pane. This will produce a chart from the requested data and jump to the Visualisation feature.

Within the visualisation feature is it easy to create charts using log data and statistical aggregations to present the data.
In the example below I create a pie chart for login attempts by country:
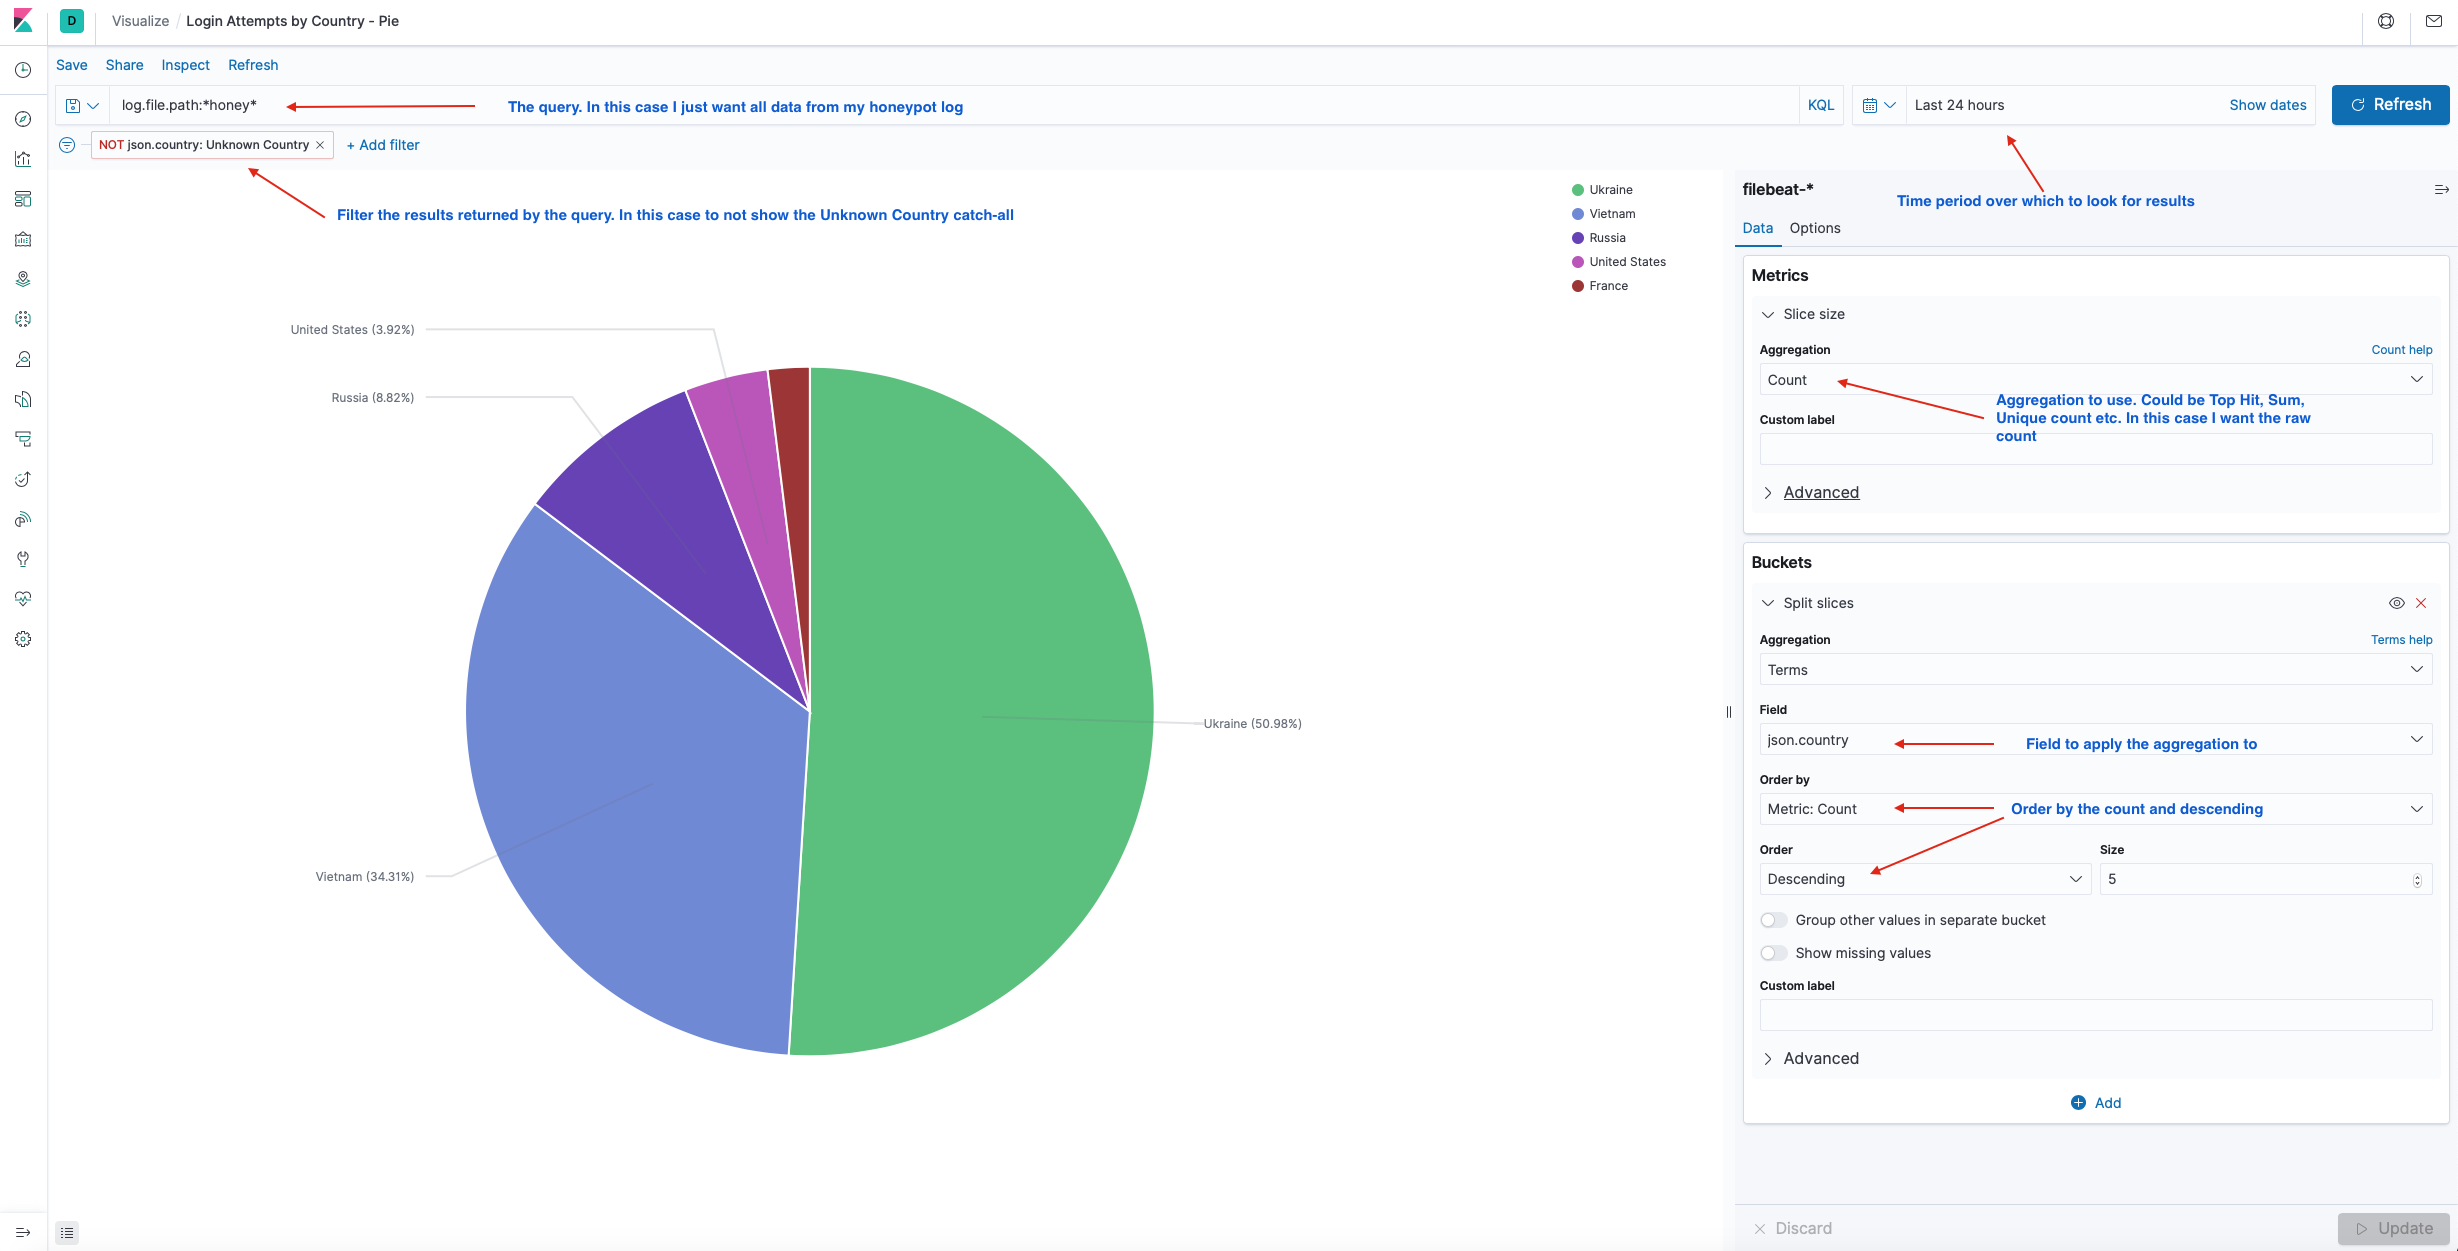
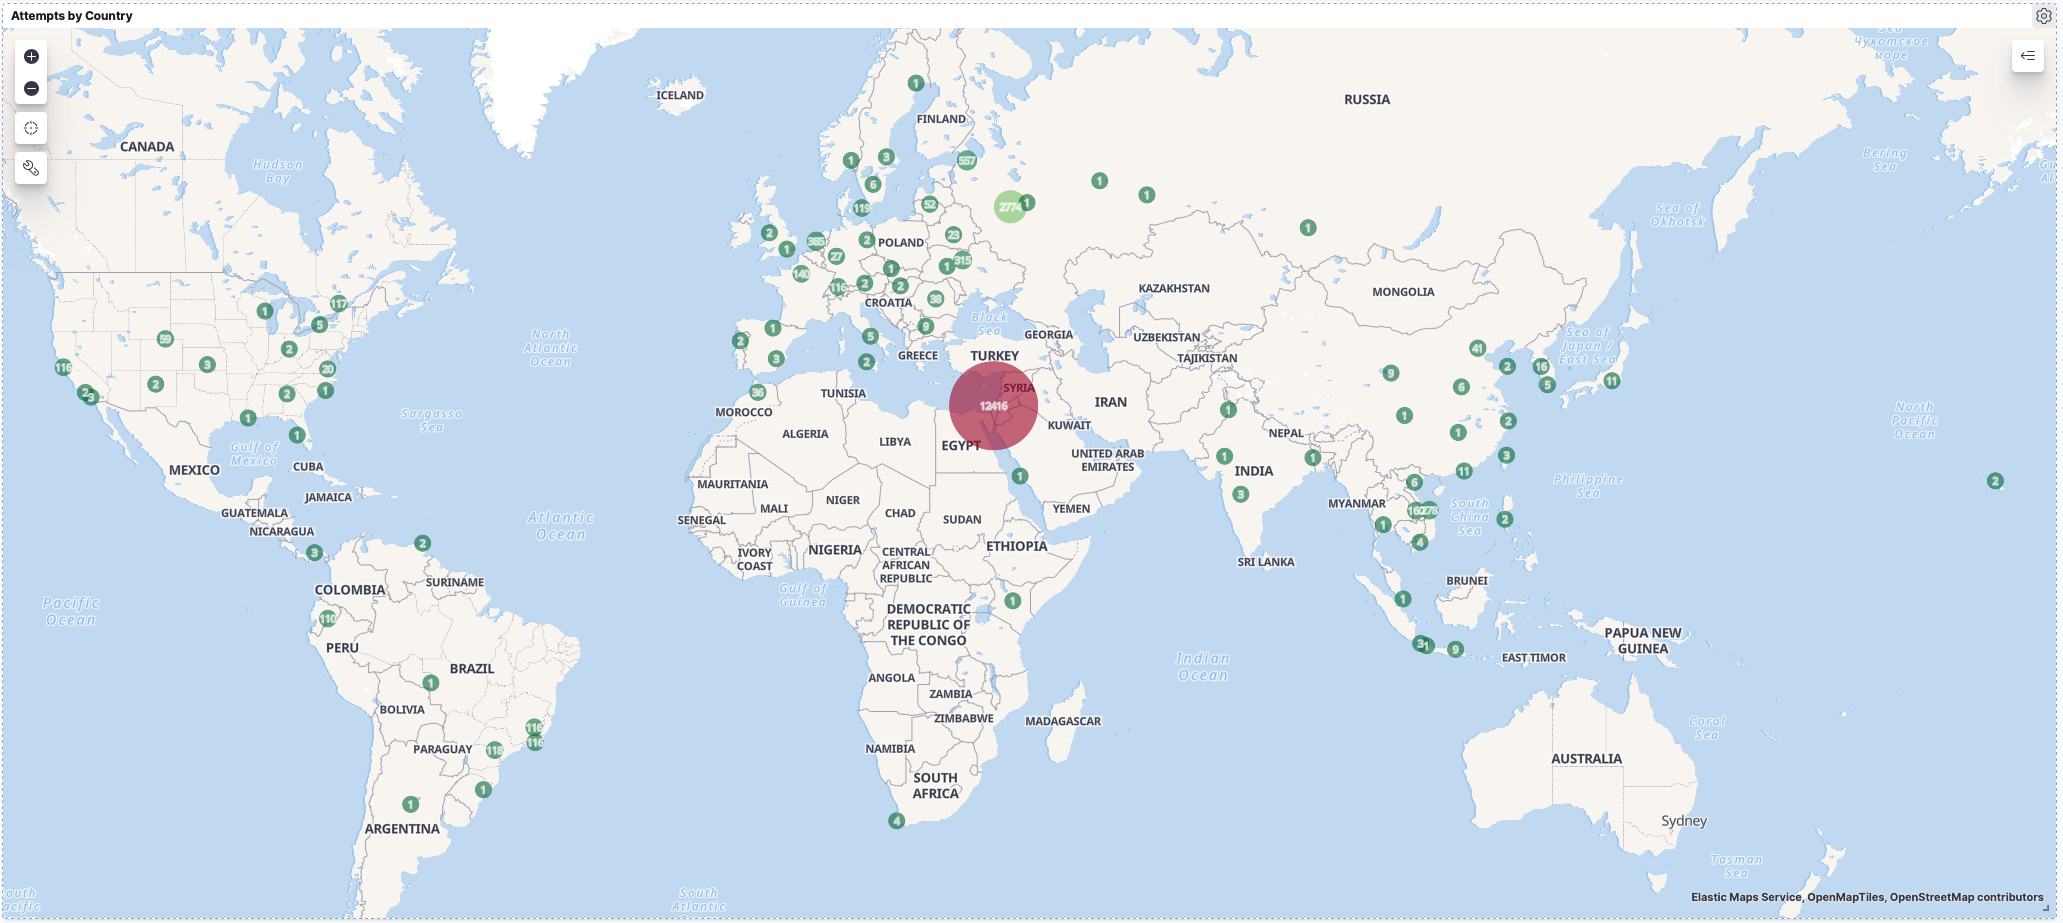
Since I collect the Geolocation data using the IP addresses, it would be neat to plot them on a map instead of just a pie chart. With Kibana, we can do that using the Maps feature.
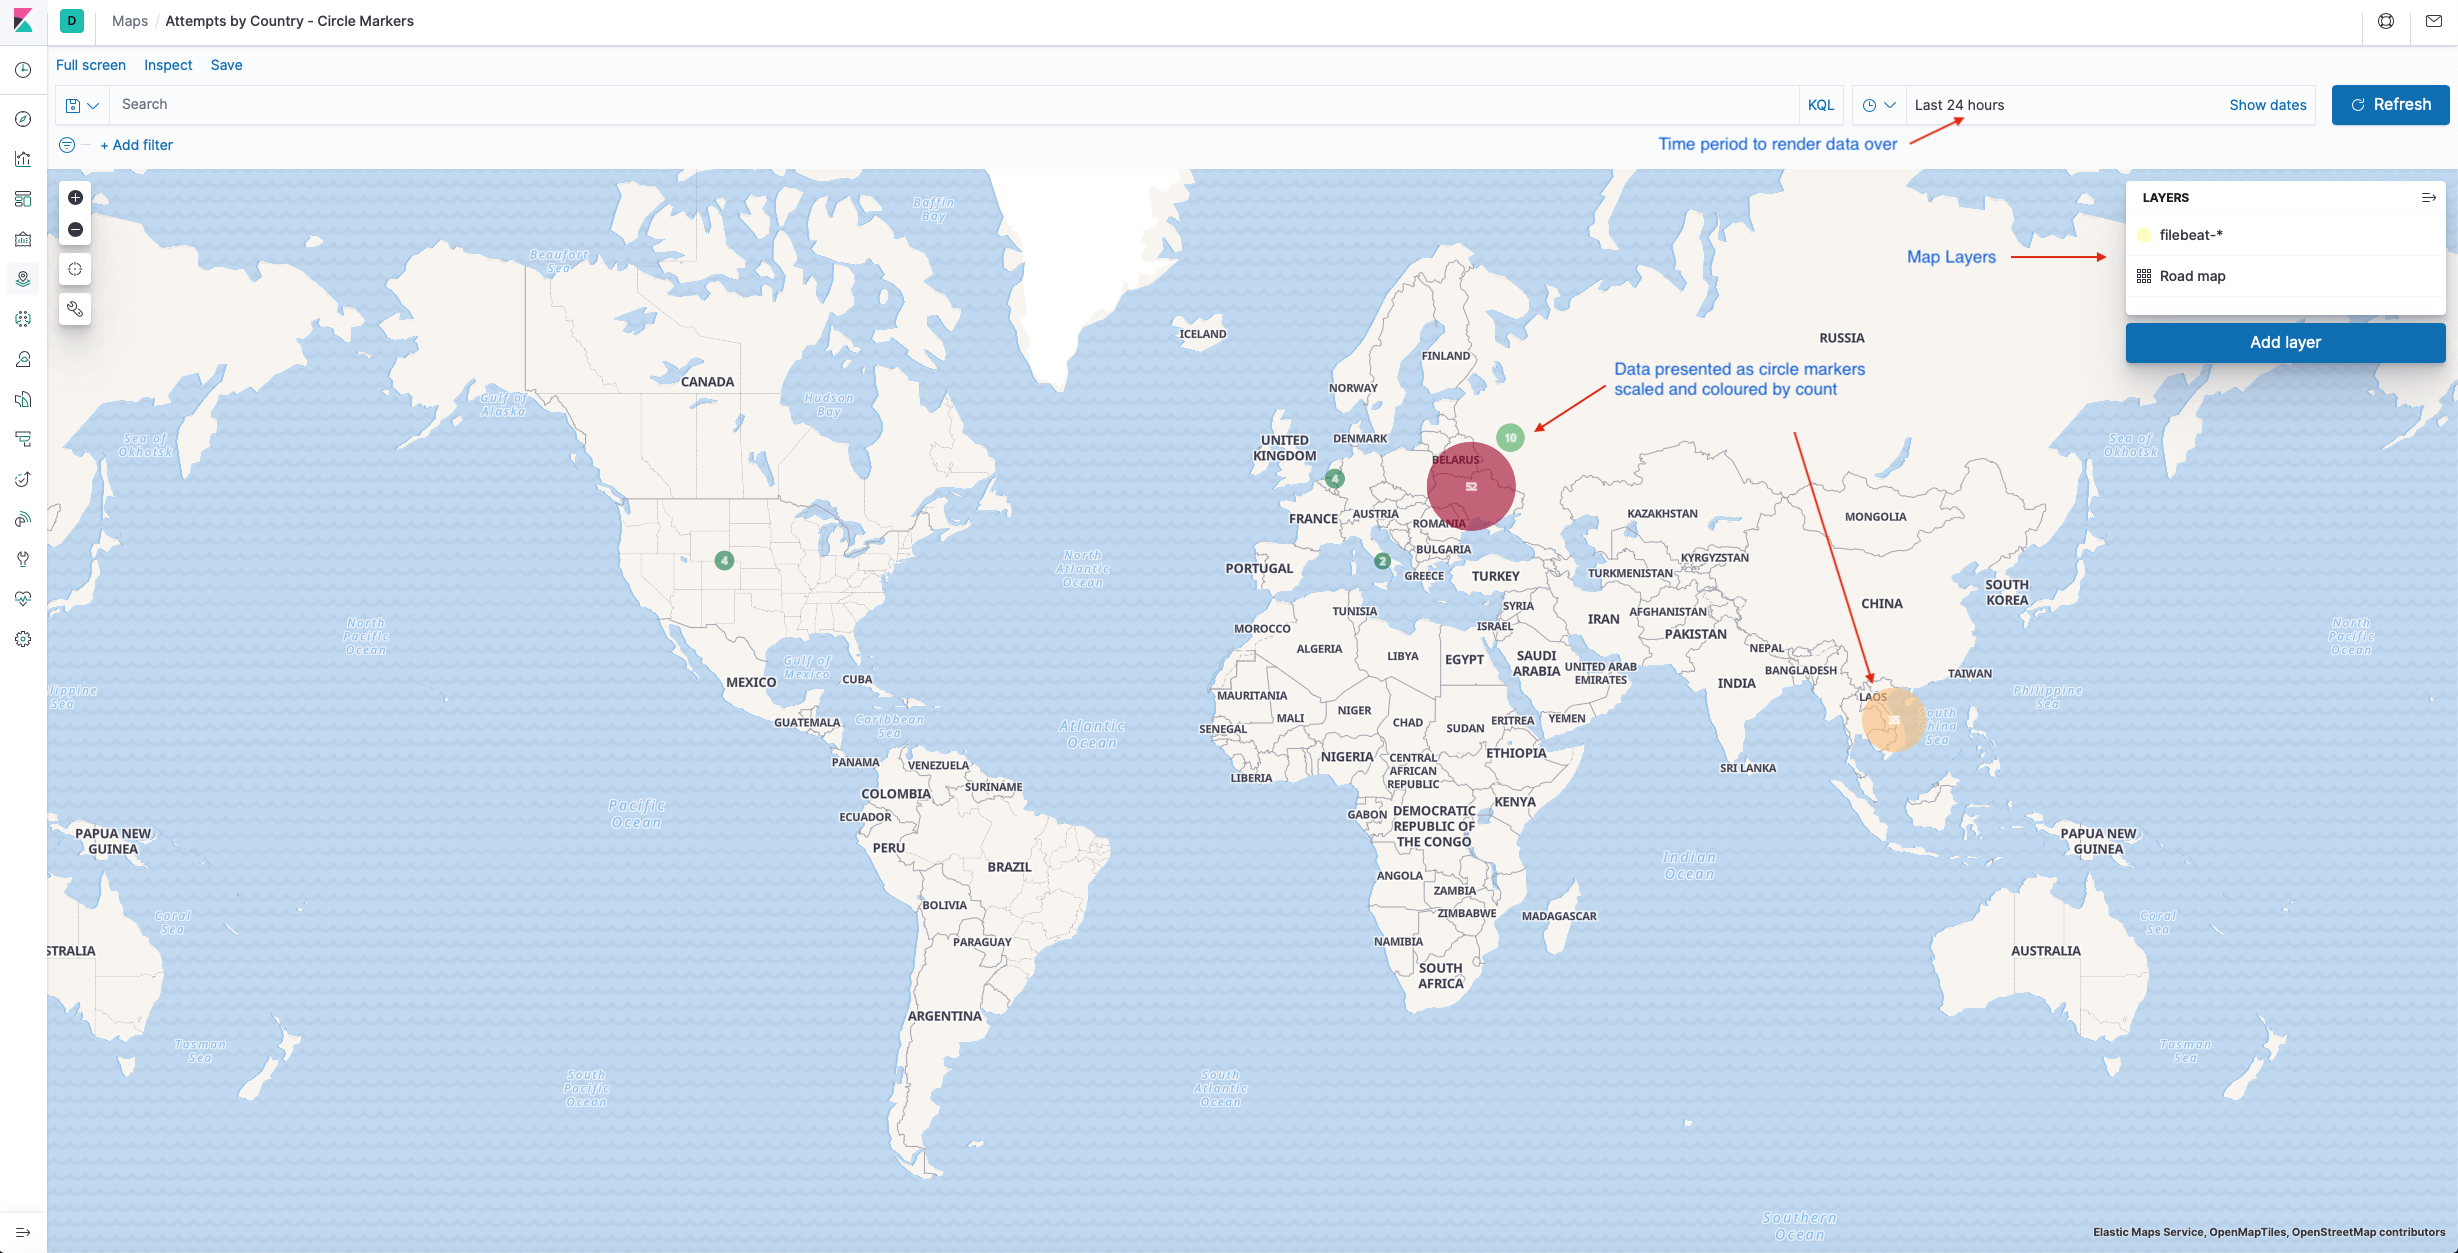
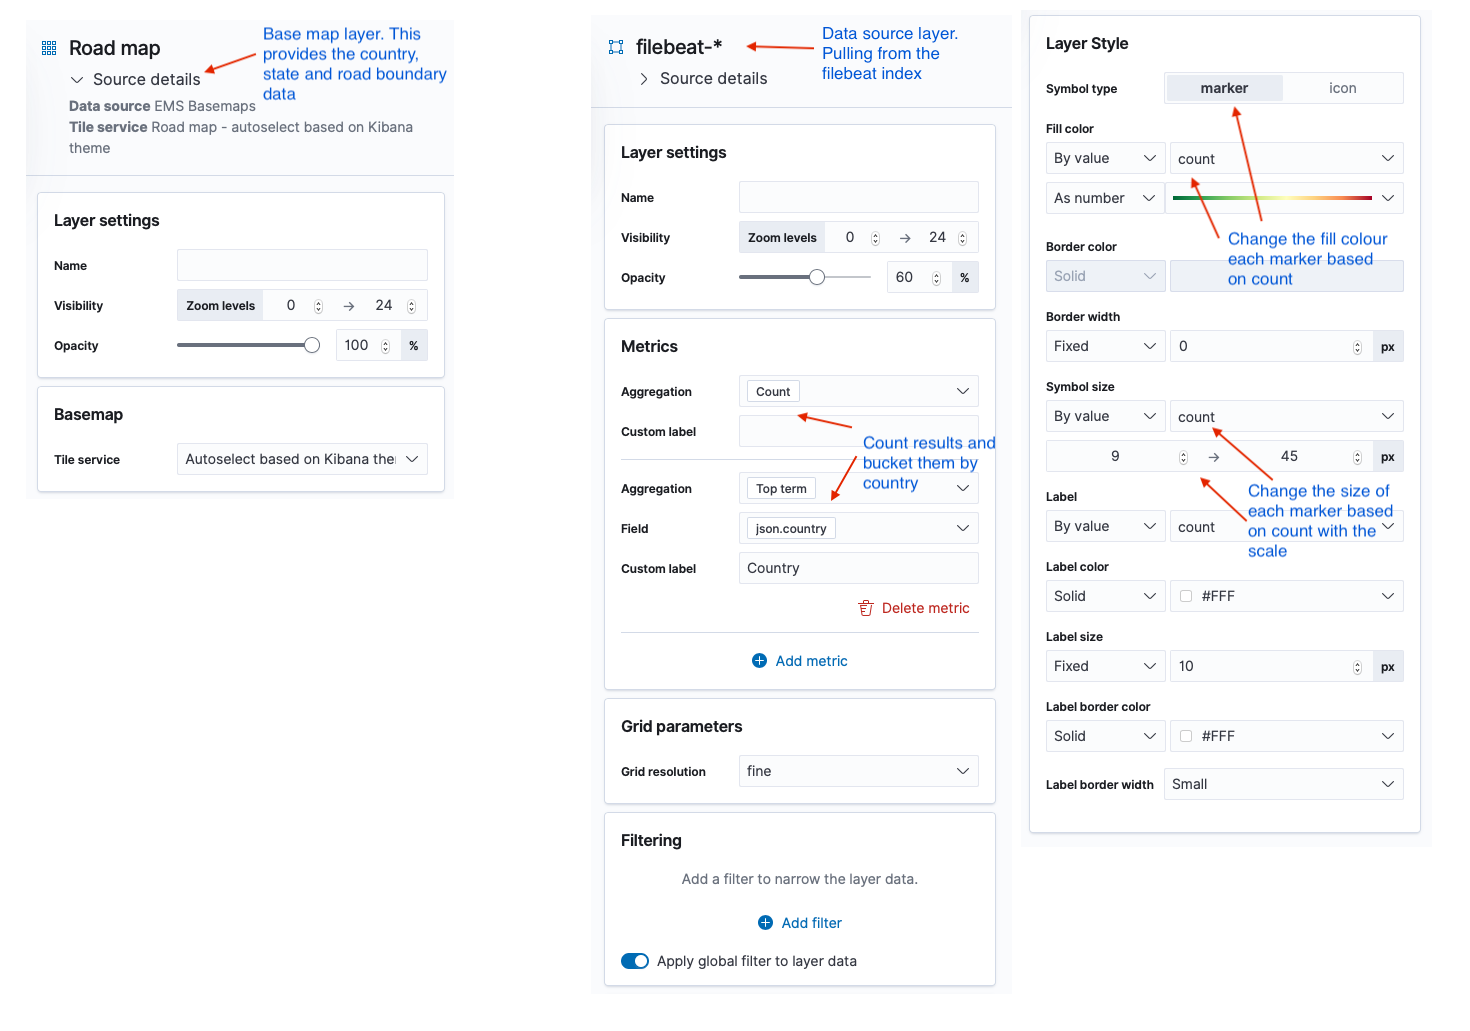
Maps are built up by layering geolocation data on top of map data tile sets. Kibana provides some basic road map tile sets that provide a world map with country and road boundaries. You can add custom tile sets or pull tile data from a web service like Open Streetmap. For my purposes the default road map tile set was fine for the maps base layer.
From there I overlay the country data indexed from my honeypot log to plot the data on the map. It’s quite easy to do once you have the concepts in hand. The layer settings I used for the map above are shown below.
Once the map is set you can vary the time period over which you want to plot data to see the distribution of data for the different timescales.
I find the fact that I can generate geolocation data from my honeypot and plot it on a world map with very little effort using these tools pretty neat!
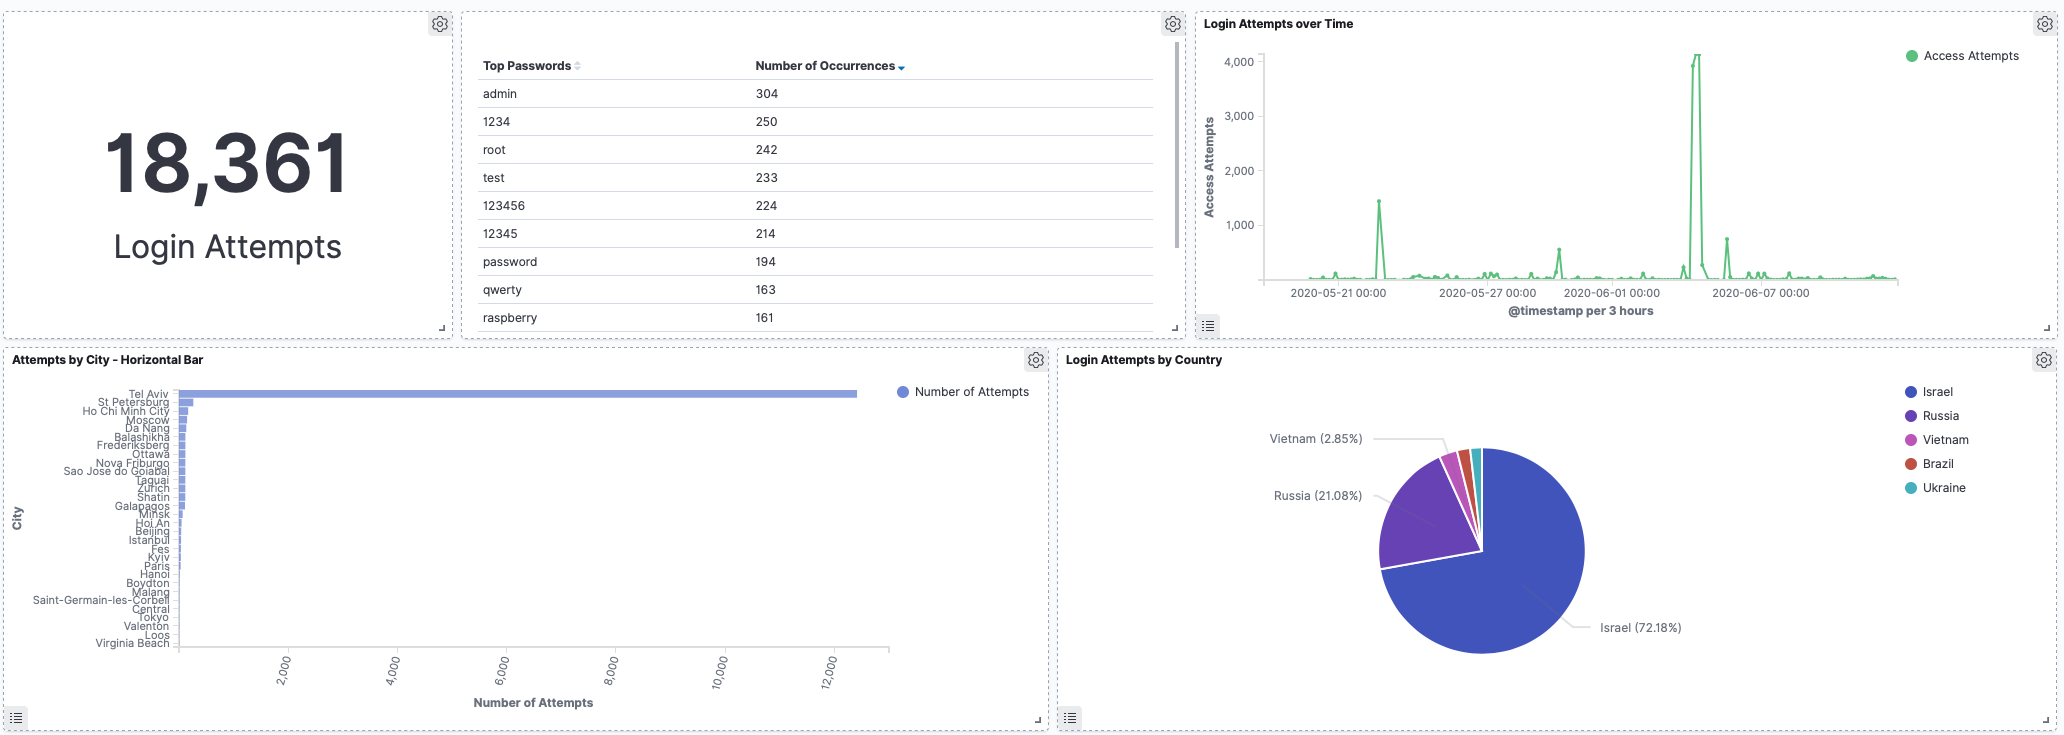
I took my map data, some stats from a discover query, a count of all login attempts and my charts and using the Dashboard feature added them all to a honeypot dashboard. This way I can get a great view of my data at any point in time.
The image below shows my dashboard for all the data collected to the point of this post. Note the big spike and the fact that Tel Aviv dominates the attempts by city count. More on this in the results below!
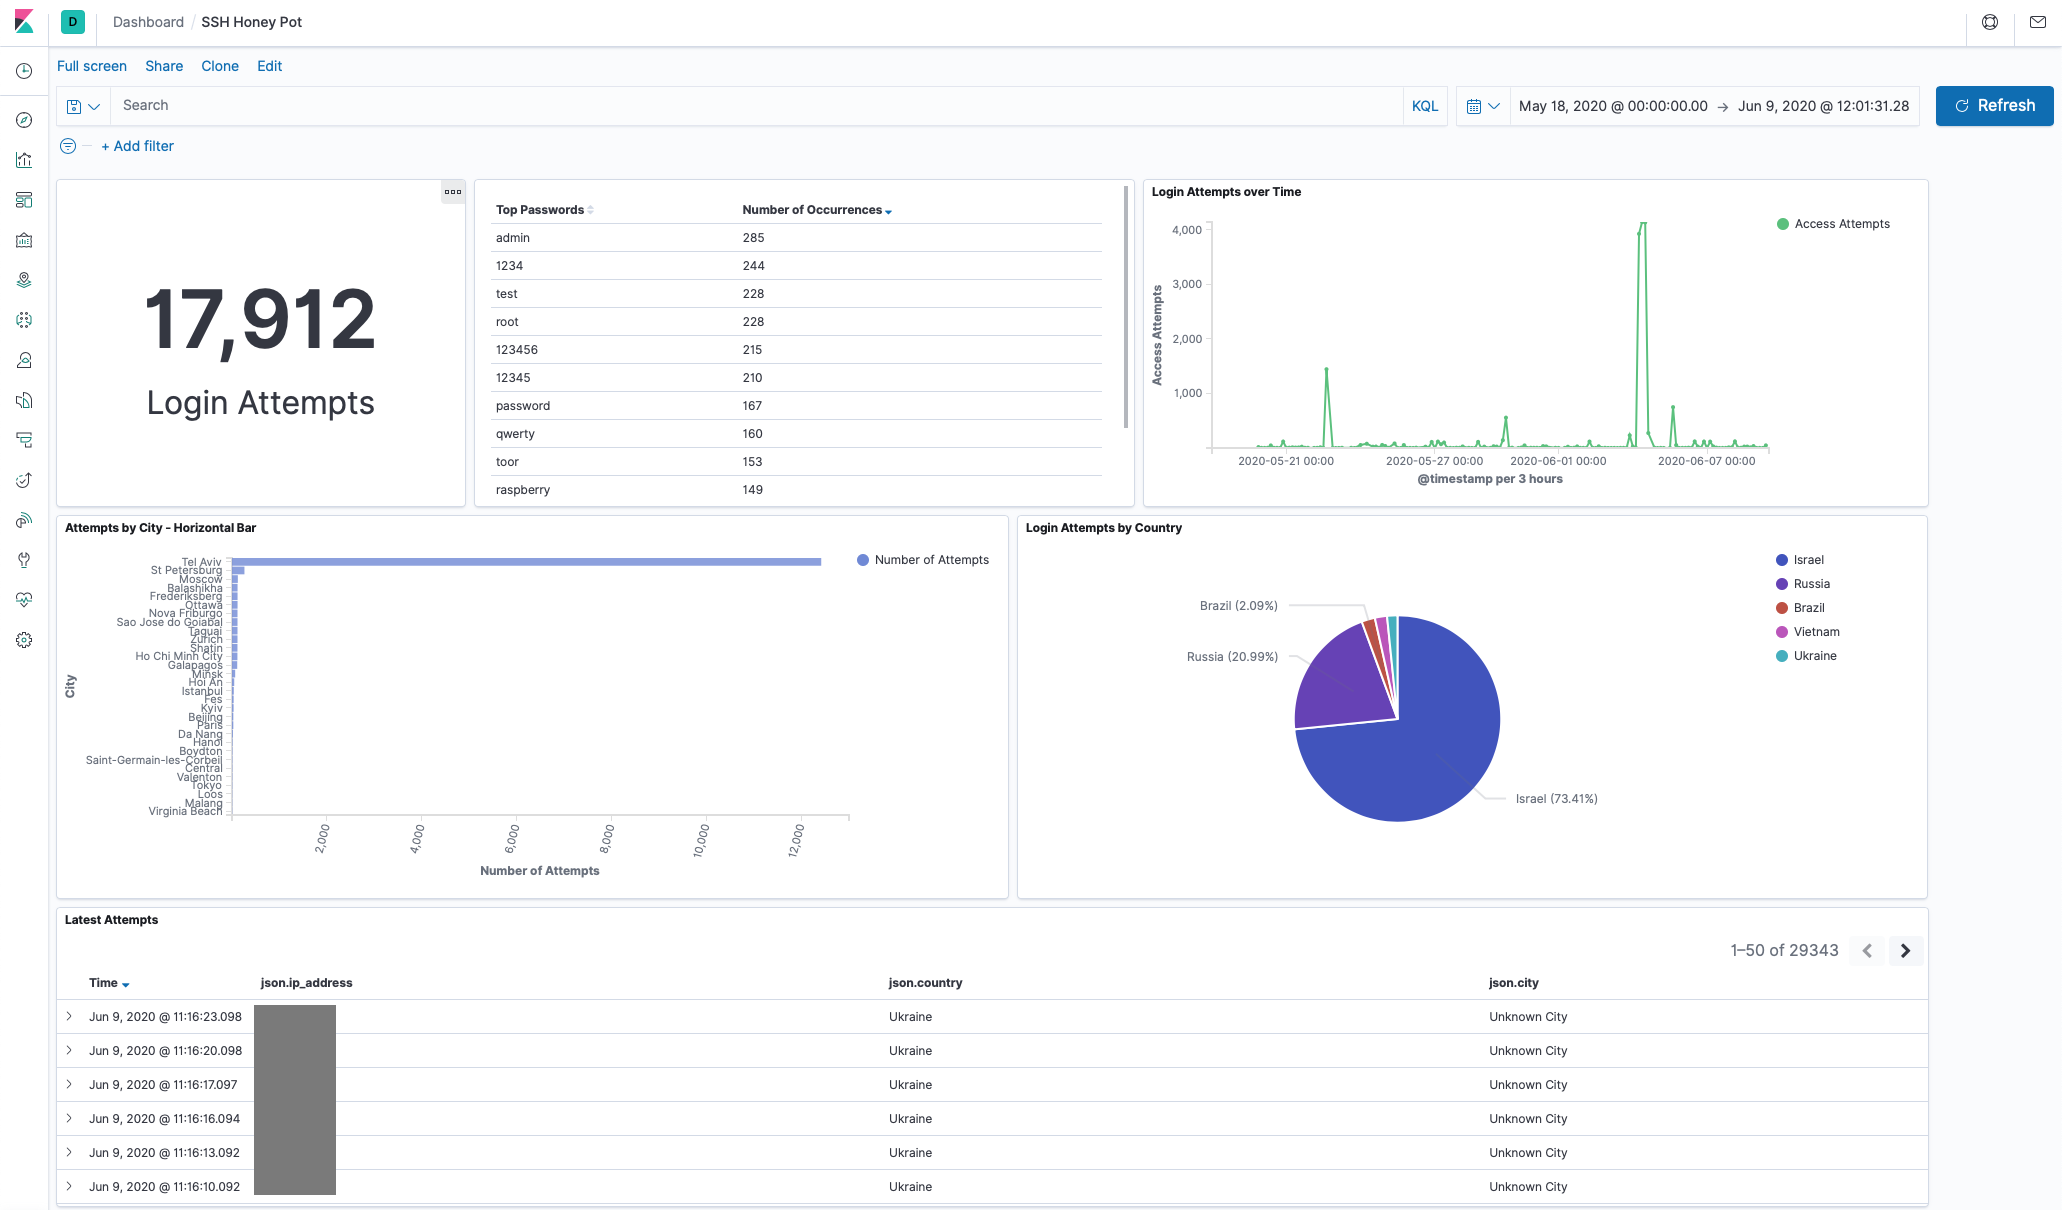
Dashboards are another feature that will be familiar to Splunk users.
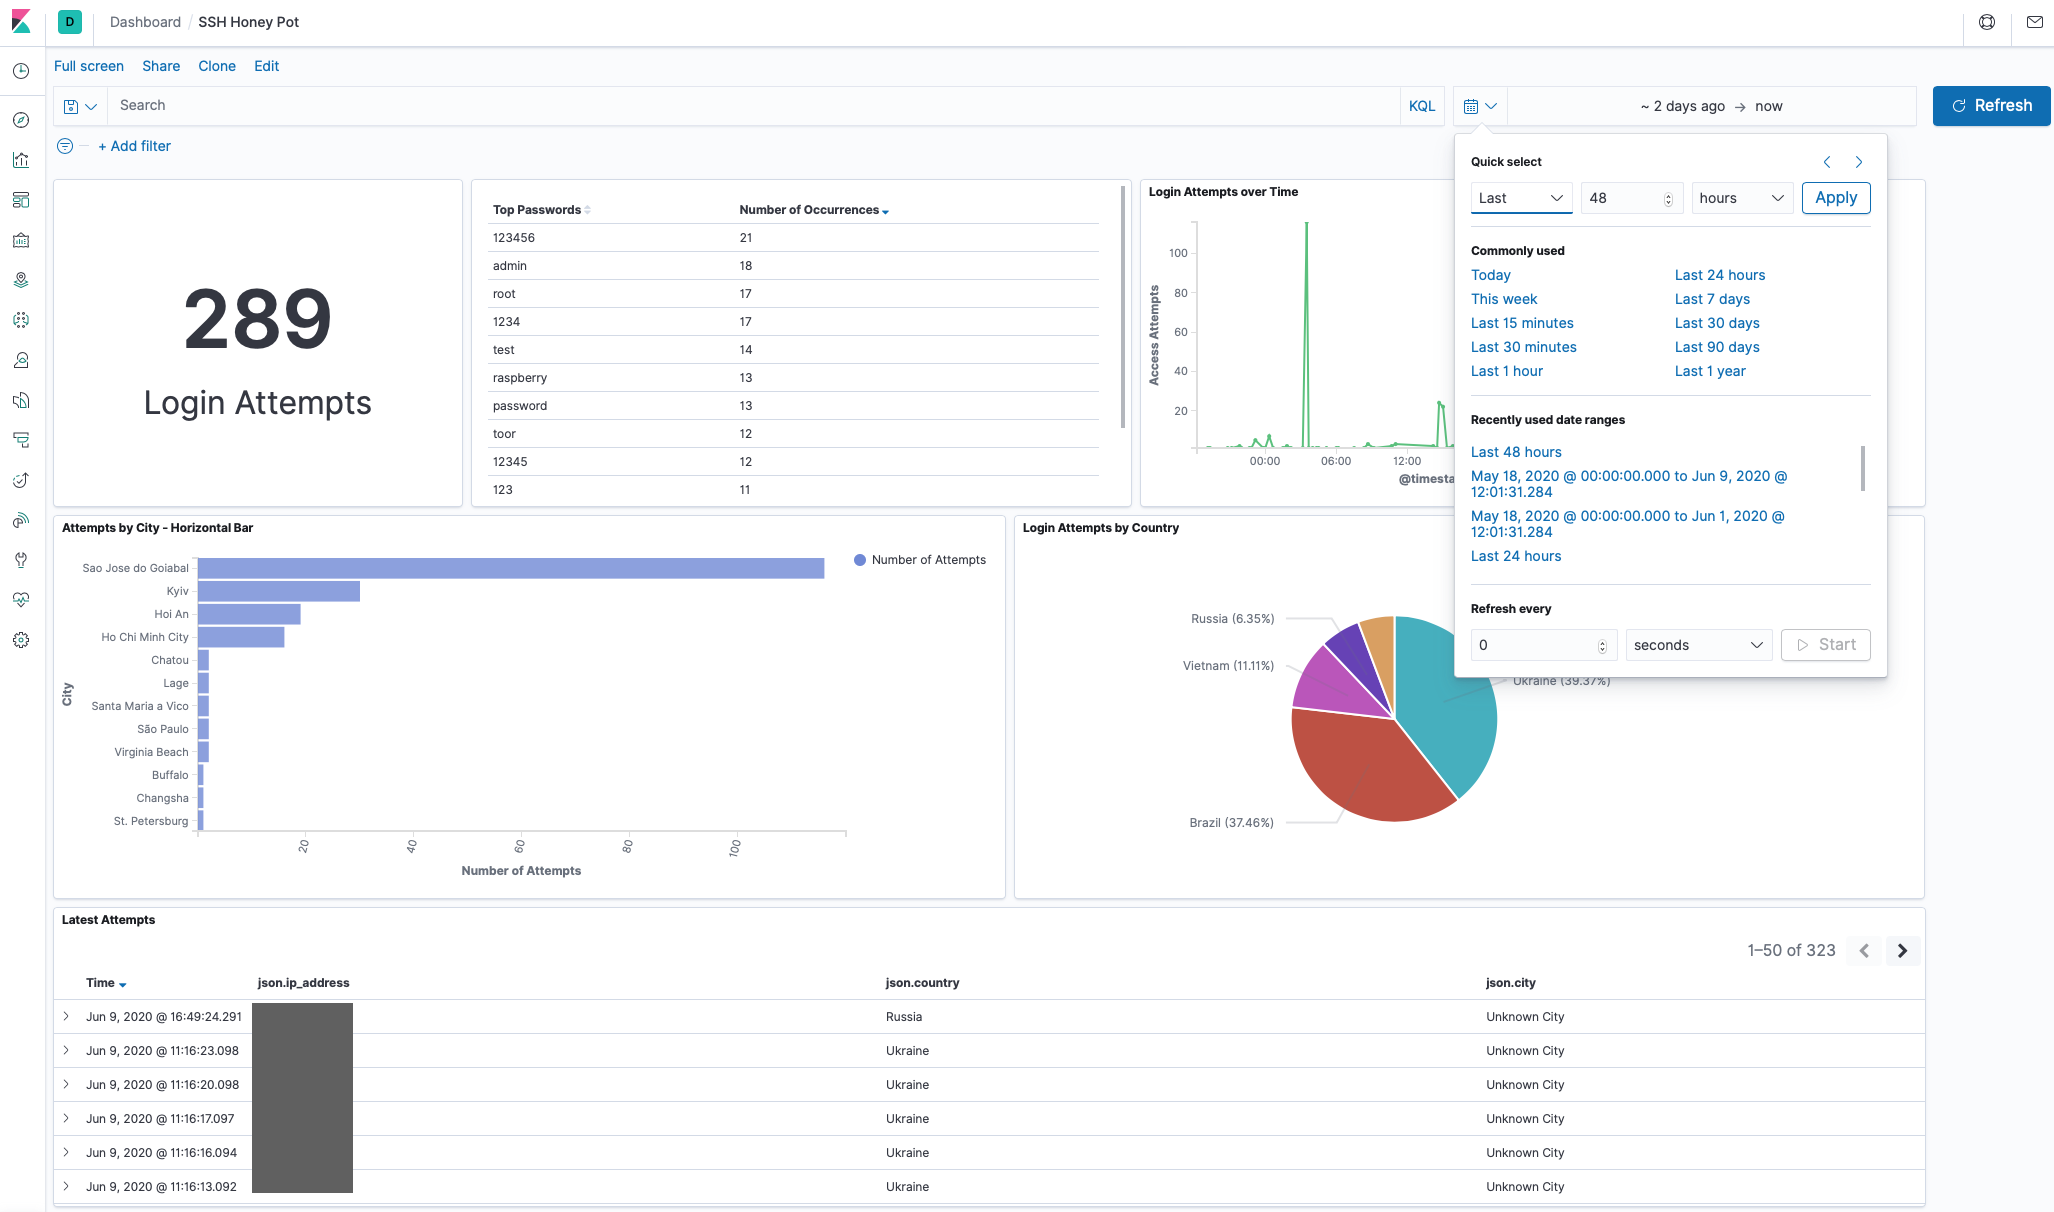
Below is a screenshot of a narrower time period showing the time period selection menu. Adjusting the time will of course update all the metrics on the dashboard. Also familiar to Splunk users:
In summary, Elastic Search fed with log data via a Filebeat agent and visualised with Kibana makes for an excellent basic analytics platform for this project. Using Kibana made it easy to visualise all the data, spot patterns and trends and review historic data. It was relatively simple to setup and get going. I did find the Elastic Stack documentation a bit frustrating at times, but given the popularity of the Elastic Stack there is no end of help and solutions to be found on the web. I’ll definitely be using it for more projects as and when required.
But what was the outcome of the honeypot experiment and all the data collection and analysis? Here are the results.
The Results
I got my first caller within 5 minutes of turning on the honeypot. But there were long gaps of no attempts. I suspect this is because the honeypot isn’t hosted on a well known subnet and most of the attempts were not persistent dictionary attacks but rather what I assumed were scripted bots and botnets trying sets of default or well known passwords and then moving on.
My results show that with the scale of the network and available attack surface it appears that it is better to try to break in using weak or default passwords and move on to the next target if you are unsuccessful. Using this method your botnet will probably hit enough vulnerable hosts that you don’t need to waste time grinding passwords.
I only saw one big attempt that used a large password dictionary.
The charts on the dashboard at the time of writing looks as follows:
Total attempts clocking in at nearly 20,000 for just under a month of uptime.
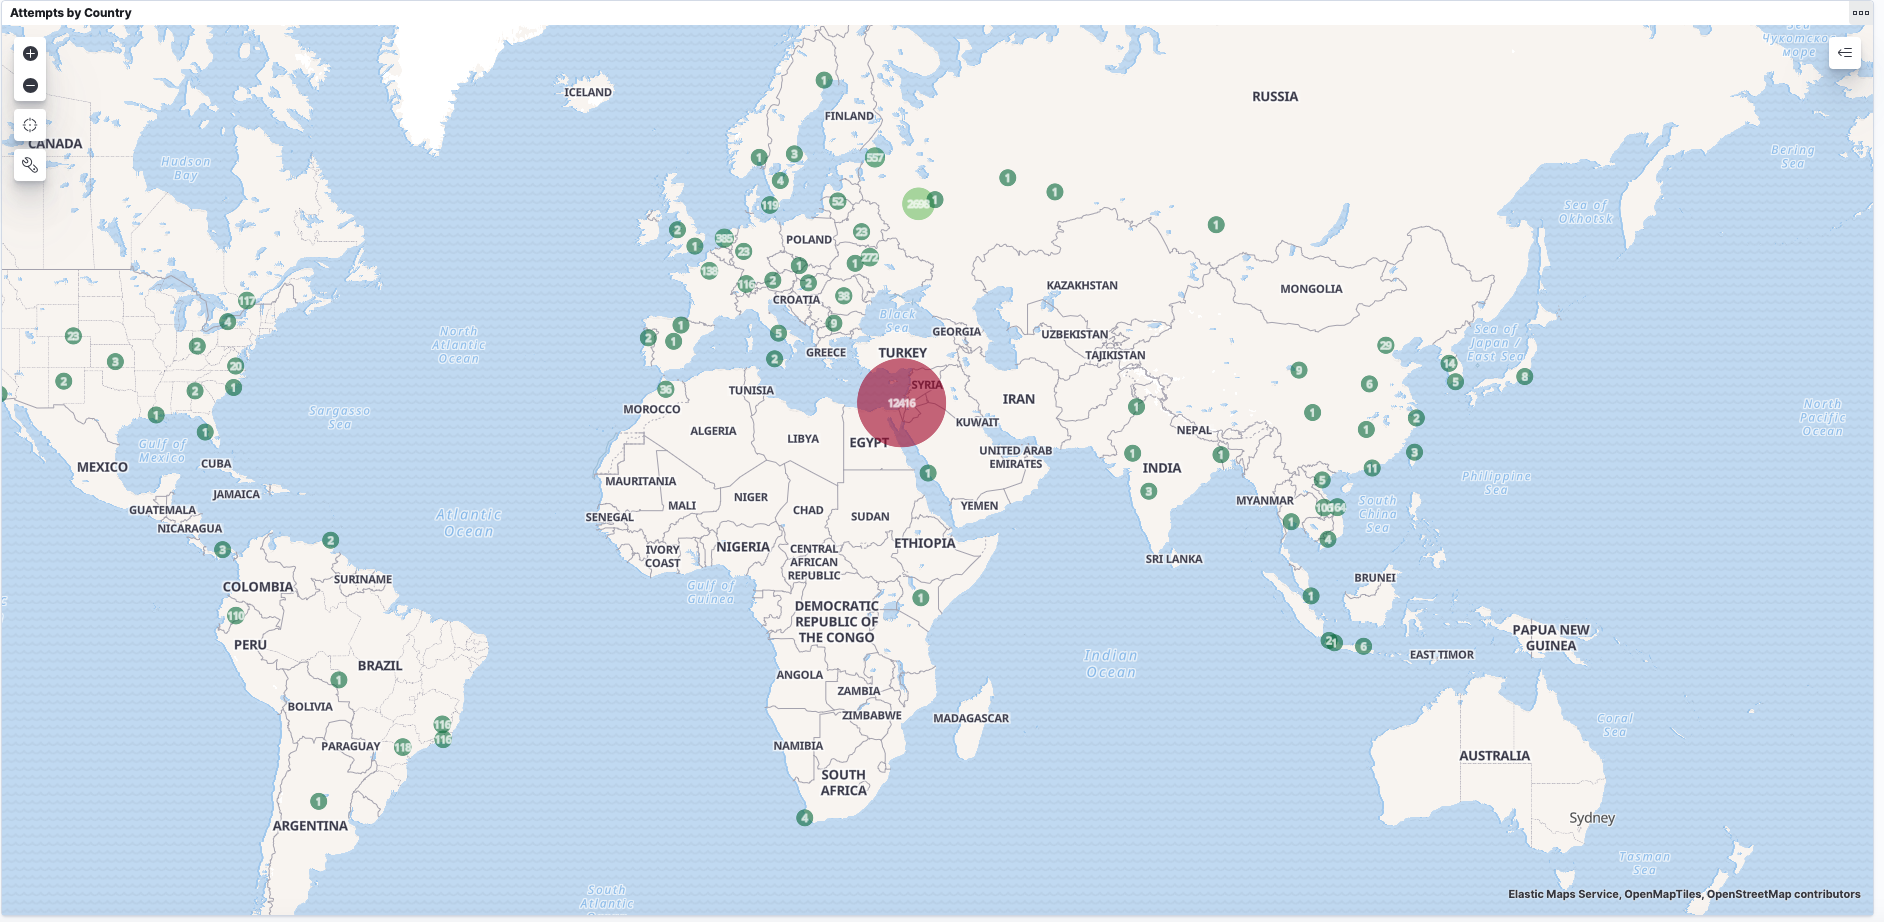
Here is the map of all attempts up till the time of writing:
Top 10 Passwords Seen
| Password | Number of Occurrences |
|---|---|
| admin | 285 |
| 1234 | 244 |
| test | 228 |
| root | 228 |
| 123456 | 215 |
| 12345 | 210 |
| password | 167 |
| qwerty | 160 |
| toor | 153 |
| raspberry | 149 |
No real surprises here. Perhaps interesting to see root backwards (toor) as one of the top 10. Clearly Raspberry Pi’s are a common target.
Note: I am not dumping all the passwords out here because I think some of the passwords look like flags that attackers use to check if they have been caught by a honeypot. I don’t want to provide that satisfaction. If you want the list, feel free to ask be on Twitter. However there are much larger lists than mine already available.
Other notable things:
- Women’s names. Probably obvious why. But makes a few assumptions I suppose!
- Many variations of the word password
- Common applications and unix services are popular password guesses: uucp, postgres, *www, ftp, mysql etc
- Words prefixed with the characters !@#$%1234 and variations and combinations therein. Clearly exploiting the fact that people get frustrated with complex password rules and just use a sequence
- Liverpool,Arsenal,Everton are the football teams attackers think everyone supports.
- The longest passwords I saw were 28 characters long. A few of the longer passwords look like tokens or flags used by the scripts to detect if they appear in any honeypot lists.
- Some passwords I saw look like they were generated by bad input to the script. For example a password that appears to be a reference to another password list.
- Swear words don’t appear as much as I would have thought. But all the top notch filthy language appears.
- No political language and no hate speak.
Needless to say, NEVER use anything like these as a password for anything!
Top 10 Usernames Seen
| Username | Number of Occurrences |
|---|---|
| root | 13,393 |
| admin | 792 |
| user | 328 |
| test | 277 |
| oracle | 206 |
| pi | 205 |
| ftpuser | 186 |
| test1 | 134 |
| test2 | 133 |
| usuario | 132 |
The root user topping the list makes sense. I was mildly surprised to see the user name oracle so high. Again the Raspberry Pi root user, pi appears high on the list. Usuario is Spanish for user and I guess it is commonly used.
Other Notables:
- Men’s names. Another assumption being made by the attackers!
- Services and applications names appear: ansible,puppet,mysql,nagios,uucp,rsync,squid and many more.
- Cloud services make an appearance: ec2-user,azureuser
- Classic super user / privileged user names: operator,system, supervisor
- A lot of router and firewall appliance default users
- A scattering of IoT device default users
- A couple of variations of fruit and pi: orangepi,bananapi,
If you have these users created make sure you have them set with complex passwords!
Top Countries and Cities
Israel tops the list with the most attempts (see the detail below):

All of those attempts coming from Tel Aviv:

Taking Israel out of the picture we see Russia as the next biggest:
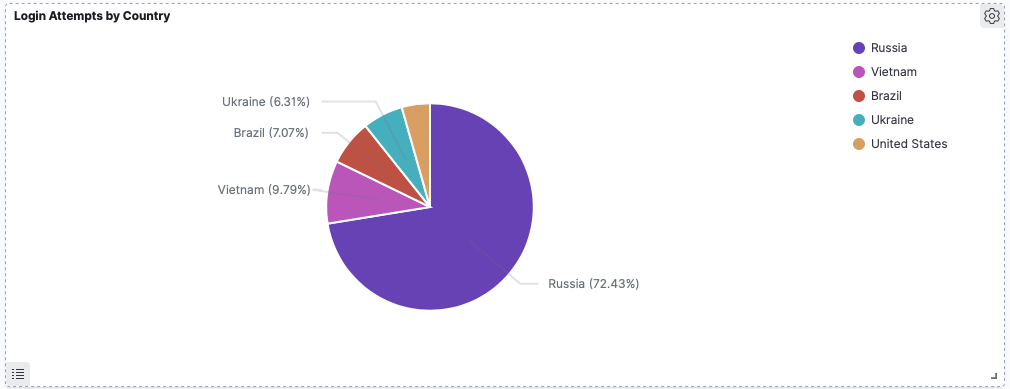
With St. Petersburg clocking in as the top city:

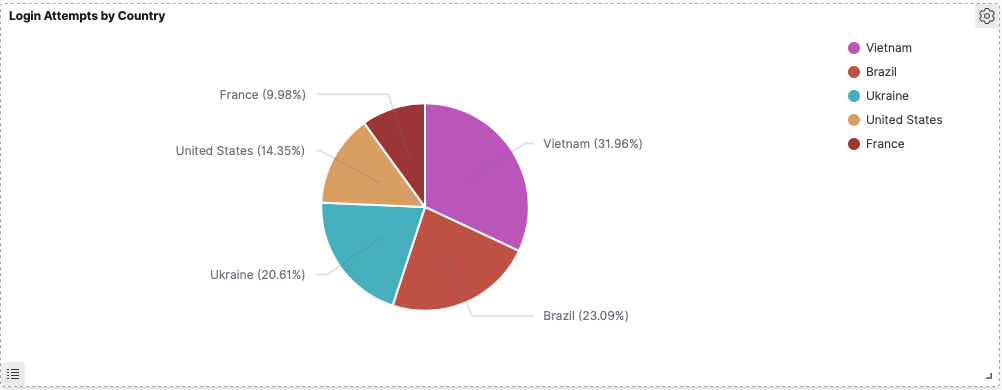
The best of the rest look like:

Note: There was a single attacker from Ottawa which generated over a hundred login attempts, but no other attempts from Canada. Hence why Canada doesn’t feature in the top countries.
Attacker Patterns - BotNets?
I spotted different patterns in the combinations of usernames and passwords used amongst the visiting attackers. I suspect a majority of the attempts were from Botnets. With a bit more effort I could probably automate mapping and detecting the different Botnet patterns and identify them. However, just visually going through the data you can see that basic patterns emerge.
There were some oddities, such as one attacher visited on 3 different occasions repeating the same 49 attempts each time. I didn’t see the same pattern from anyone else.
An attacker (or attackers) from Vietnam stopped by consistently every few days and tried their own unique set of user names and passwords.
One visitor may have been onto the fact the SSH server was not what it appeared. Trying the user ‘honey’ and password ‘pot’
I saw what I think were a couple of bigger botnets knocking on the door. In one case there were at least 10 different attackers or at least attempts from 10 different countries or source addresses that used the same 117 or 116 username and password combinations. Looking at the data it looks like something trying to login using the most common passwords and most common users while also trying IoT device default passwords and some common appliance passwords. If I had to guess, it’s some sort of script that is looking for specific targets to use a specific payload with. The different countries / source addresses does indicate it’s a botnet executing the attempts.
A lot of the these attempts originate from Russia. It looks to me like a number of similar botnets are run out of infrastructure hosted in Russia.
The frequency with which these things turn up suggests that there is a lot of botnet activity pulsing around the global internet. It would be interesting to dig into the data and see if it possible to map them out a bit more.
The Raspberry Pi BotNet
Then there was the Raspberry Pi BotNet that came to visit. I noticed a spray of logins very close together from very different locations. They all tried the user ‘pi’ and password ‘raspberry’ then straight away followed by the user ‘pi’ and password ‘raspberryraspberry993311’. I did some research into this and apparently it is a BotNet that looks for Raspberry Pi’s and first tries to login with the default user name and password and if it succeeds it will change the password to ‘raspberryraspberry993311’. So when it visits it tries both logins. I am pretty sure I also saw other other attackers or botnets are looking for the same login, trying to exploit the work already done by another attacker.
I was going circle back and look into this botnet further by deploying a more sophisticated honey pot to observe what this this tries to do, but it turns out there is already a write up on it in Linux Magazine by Rainer W. Gerling who did all the work to dissect what this thing is doing.
By the looks of it the first job of the malware is too propagate from the compromised Raspberry Pi device and look for other Pi’s to exploit. At the very least the malware builds a great distributed scanning platform, but I assume the main goal is to build the botnet that can be used for any purpose by the attacker later on.
It was really interesting to see this thing visit and being able to identify it. Clearly there are a lot of compromised Raspberry Pi’s on the internet and the botnet is wasting no time looking for more.
The Big Password List
During operating period I saw a single attacker try to break into the root account using a big password list. This attacker from Tel Aviv (notice the charts above) tried ~23 passwords / minute for 9 hours. For a total of 12,338 attempts. By far the biggest single attempt to break in via the root user and made up the bulk of all attempts to break-in. After that one big attempt the attacker went away. I know Tel Aviv is a hot bed of cyber security companies, don’t know if this is just coincidence, a random attacker or someone running an experiment.

Takeaways
The main takeaways from all this are not earth shattering, but were certainly reinforced for me. These are:
- Use long, diverse and randomly generated passwords. A determined attacker will break in if you use anything that resembles an English (especially) word.
- Don’t use default or service users for anything. If you must, make sure the password is long, complex and random.
- Avoid single dictionary words, even if you are replacing characters with numbers or symbols. Many large password dictionaries will contain or generate on the fly variations on common words
- If you run a server exposed to the internet on a well known port. Especially ssh servers, expect to get visited by unwanted guests and take action to prevent continued attempts (see the Appendix below)
- Change default credentials. Even if you think you haven’t exposed anything to the internet, change them as a matter of habit.
- Be careful with your IoT devices like smart home things, camera’s printers etc. Enough IoT credentials turned up in the attempts I saw to suggest these don’t get changed enough and are exposed to the internet such that they of great value to attackers.
- BotNets are prolific and automate the exploits. The lone determined attacker still exists but by far the biggest threat is automated bots and botnets.
Appendix - Best Practises when Exposing Real ssh Interfaces to the Internet
For many, this will be old news, but I am going to say it anyway because it is clear from my experiments that there are people out there spending time looking for vulnerable SSH servers so they must exist. I suspect, from looking at the results, a lot of people put Raspberry Pi’s running an ssh server on the internet.
There are many reasons you might want to expose a real SSH server to the internet. It is certainly convenient for remote access. If you run a server hosted by a cloud provider you probably use SSH for remote administration by necessity. If you do, you should make sure you do the following:
Check your logs regularly
Make a habit of checking /var/log/auth.log and /var/log/messages regularly for any unusual access attempts or behaviours. Even with mitigations suggested below in place, looking at logs is a good habit to have. I am surprised at how many people don’t do this.
Disable remote root login
These days many Linux distributions will come with the root login disabled for remote login by default.
Disabling the root account remote login access means attackers will never have success logging is as the root user remotely. To ensure to root user can’t login check that the PermitRootLogin root login property in your sshd config is either not set or is set to no. The sshd config is typically found in /etc/ssh/
If possible, disable password auth
If you can, disable password auth completely and use public key auth only for ssh logins. Not going to go into huge detail here (plenty of guides already available), but first use ssh_keygen to generate a public and private key pair for your ssh login. Add the public key to ~/.ssh/authorized_keys and test your login. If all goes well you should be automatically logged into your session without requiring a password.
If it doesn’t work, first check that the PubkeyAuthentication option is set to yes in your sshd config. yes is the default so unless it is set to no it should work.
A second pitfall is carriage return characters in your authorized_key file. Check the public key you added to the ~/.ssh/authorized_keys file is a single line with no carriage returns.
Once you have verified you can login using a public key, disable password authentication by setting PasswordAuthentication no in your sshd config file.
Be careful here! Make sure you either have console access to your machine OR you have made sure public key auth works before locking yourself out of your own machine!
If you want to be extra fancy / extra secure, you can load your private key onto a Yubikey and configure it for use with ssh auth and remove your private key completely from your client machines.
Whitelist
In many cases it may be better to block ssh from being wide open to everyone and just restrict it to certain IP addresses. This can be done by adding IPTables rules. This is great if you have a fixed location you need to access your machine from, but of course it severely limits the utility of the remote access function of ssh.
Use an Alternative to ’naked’ ssh
It may be better not to expose ssh to the internet at all and use a VPN option such as Wireguard for remote access. A VPN configuration is generally a much more painful target for an attacker and will be too big a barrier for most to even bother with.
A VPN is less convenient perhaps than raw ssh as it requires extra client side and server side software to function but these days there are very easy to setup and configure VPN options it may be worth it for the better security.
Intrusion Detection and Prevention and Blacklist
If you must leave password auth enabled and expose ssh to the internet, then it is critical to blacklist persistent bad actors. Luckily this can be done automatically and very easily using intrusion detection/prevention software like fail2ban.
fail2ban monitors log files and detects malicious activity like repeated attempts to login via ssh. When it detects a repeated failed attempt to login via ssh it will add an IPTables rule to block the originating IP address thus preventing any further attempts to login from the offending address.
Be careful here though, you can ban yourself if you set fail2ban to be too aggressive on blocking failed attempts and you mistype a password or two!